
Solving Quadratic Equations by Emily
Loading the math board and drawing, please wait…
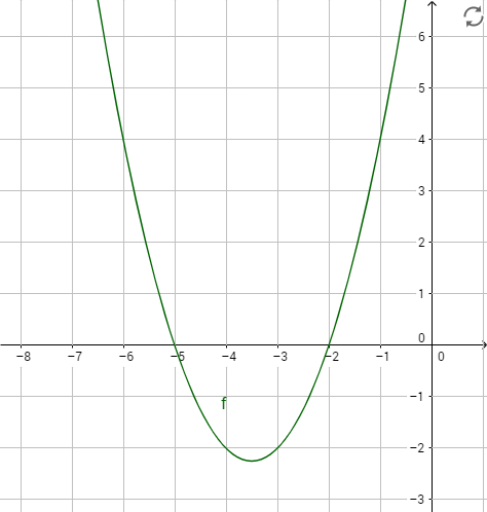
This example demonstrates how to use GeoGebra to graph a quadratic function and show its intersections with the x-axis (the roots of the equation). Core mathematical concepts include quadratic functions, parabolas, equation solving, and function graphing. Key construction points involve using the GeoGebra f object to define the function and finding intersections by calculating function values and plotting the graph. Suitable for high school mathematics teaching, helping students understand the relationship between the solutions of quadratic equations and the graphs of quadratic functions.
GeoGebra Commands & Parameters
y = x^(2) + (7 * x) + 10