
Solving Problems with Venn Diagrams
Loading the math board and drawing, please wait…
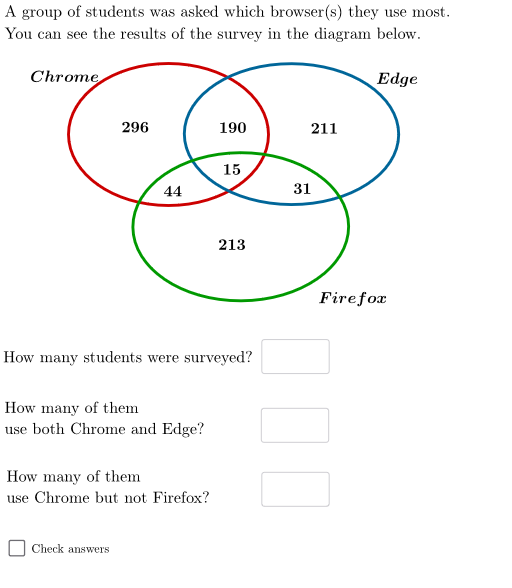
This example demonstrates the relationships between sets using Venn diagrams, involving basic set theory concepts. Using GeoGebra commands such as Random, Ellipse, and Textfield, it dynamically illustrates intersections, unions, and complements of sets. Suitable for middle school and above students to learn set theory and probability statistics.
GeoGebra Commands & Parameters
Random(1, 4) → typeRandom(260, 350) → aRandom(170, 190) → bRandom(180, 220) → cRandom(20, 50) → dRandom(15, 50) → fRandom(20, 50) → gEllipse(A, B, C) → eEllipse(D, E, F) → kEllipse(G, H, I) → pLaTeX(a, true, false) → text1LaTeX(b, true, false) → text2LaTeX(c, true, false) → text3LaTeX(d, true, false) → text4LaTeX(f, true, false) → text5LaTeX(g, true, false) → text6LaTeX(h, true, false) → text7Textfield(aStud) → InputBox1Textfield(bStud) → InputBox2Textfield(cStud) → InputBox3
AI Drawing Prompt Reference
Draw a Venn diagram to illustrate the relationships between three sets A, B, and C. Set A has between 260 and 350 elements, set B has between 170 and 190 elements, and set C has between 180 and 220 elements. Use ellipses to represent sets A, B, and C, and show their intersections. Add labels to the diagram to display the number of elements in sets A, B, and C, with random numbers ranging from 20 to 50, 15 to 50, and 20 to 50 respectively.
The prompt above was compiled from the original drawing commands and is for reference only.