
Solving Linear Equations of the Form ax + b = c
Loading the math board and drawing, please wait…
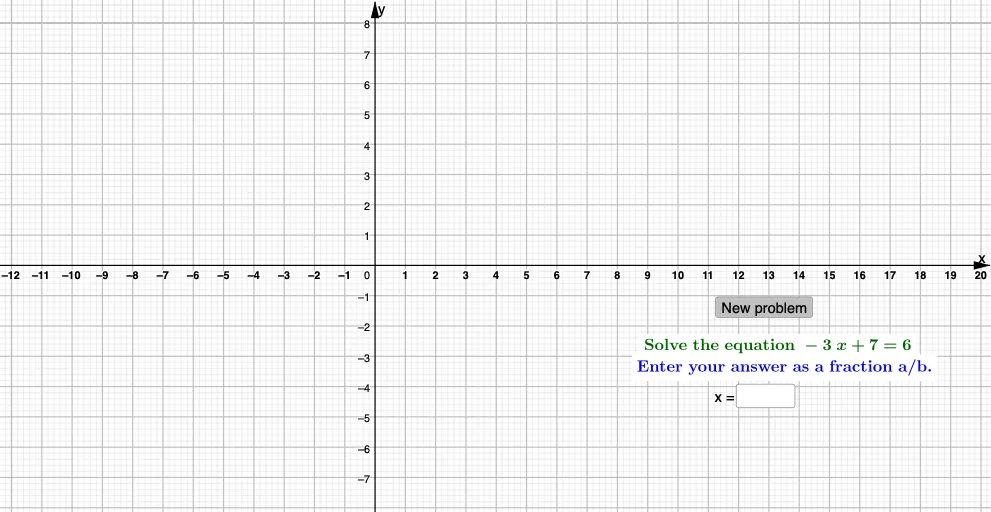
This GeoGebra example demonstrates how to solve linear equations of the type ax + b = c interactively. It visualizes the solution process by graphing the linear function and using the intersection of lines, while allowing users to adjust parameters a, b, and c via sliders or random generation. Core concepts include solving linear equations, function graphs, parametric modeling, and graphical solution methods. The construction uses GeoGebra commands such as Random, Intersect, Textfield, If, and Point to dynamically display the solution and provide an input box for verification. It is designed for high school algebra and introductory function courses, serving as an effective interactive tool for exploring linear equations.
GeoGebra Commands & Parameters
Random(-8, 8) → aRandom(-8, 8) → bRandom(-8, 8) → cIntersect(f, g) → AFractionText(e) → text2Textfield(h) → InputBox1If(e ≟ h, "Correct!", "Wrong. Try again.") → text4FractionText(j) → text6Point(g) → BInvert(f) → p
AI Drawing Prompt Reference
Draw a graph of a linear equation to show how to solve ax + b = c by adjusting parameters a, b, and c. The graph includes a line and another line, their intersection represents the solution. Users can change parameters via sliders or random generation to see how the solution changes. An input box is included for verifying the solution.
The prompt above was compiled from the original drawing commands and is for reference only.