
Solving Linear Equalities
Loading the math board and drawing, please wait…
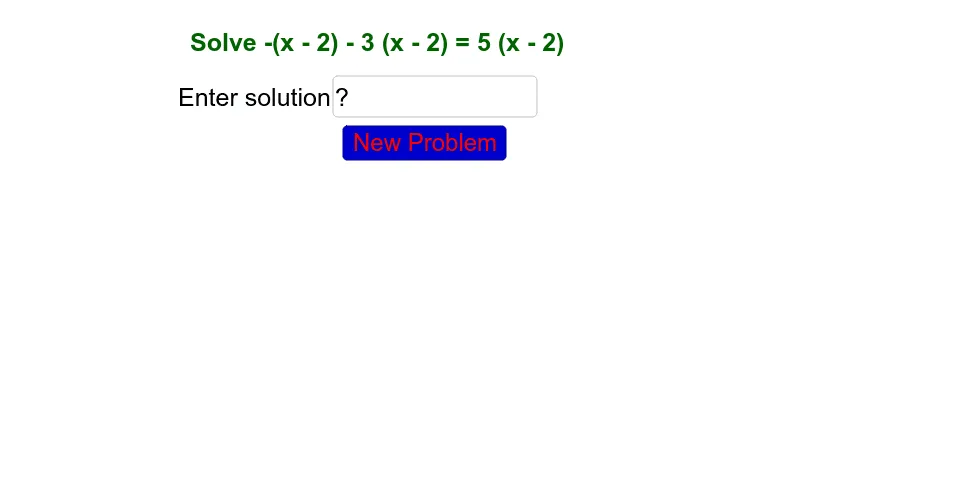
This example demonstrates the process of solving linear equations through graphical representation, showcasing the solution set of equations. Core math concepts include addition, subtraction, real numbers, 2D vectors, and definite integrals. It utilizes GeoGebra commands and objects such as Random, RandomElement, Simplify, Intersect, Textfield, and If. Suitable for high school mathematics teaching or self-study to enhance understanding of linear equation solving.
GeoGebra Commands & Parameters
Random(-7, 7) → cRandom(-7, 7) → a1RandomElement({-2, -1, 1, 2}) → dRandom(-7, 7) → bRandom(-7, 7) → aSimplify(f) → f1RandomElement({">", "<", "≤", "≥"}) → eIntersect(g, k) → ATextfield(enti) → inputBox1If(abs(enti - i) < 0.02, true, false) → j
AI Drawing Prompt Reference
Draw two linear inequality graphs to show their solution sets, with lines determined by randomly generated slopes and intercepts, and express different inequality relationships using various symbols, marking the intersection points, and adding an input box with a verification function next to the graph.
The prompt above was compiled from the original drawing commands and is for reference only.