
Solving Inequalities with Geometric Representation
Loading the math board and drawing, please wait…
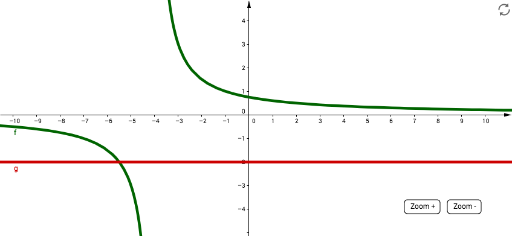
This example demonstrates how to solve inequalities using GeoGebra and visualize their geometric representations. Key math concepts involved include solving inequalities, 3D vectors, calculus, pie charts or circle charts, piecewise functions, and percentages. Construction highlights involve GeoGebra commands and objects such as Textfield, Line, objects f, g, list1, list2, InputBox1, InputBox2, text2, equal, button1, A, B, a, region, button2, text1, text4, text3, and Centro. Suitable for high school and above students to learn and understand the geometric meaning of inequalities and the application of related math concepts.
GeoGebra Commands & Parameters
Textfield(f) → InputBox1Textfield(g) → InputBox2Line(A, B) → a