
Solving Inequalities and Graphing on a Number Line
Loading the math board and drawing, please wait…
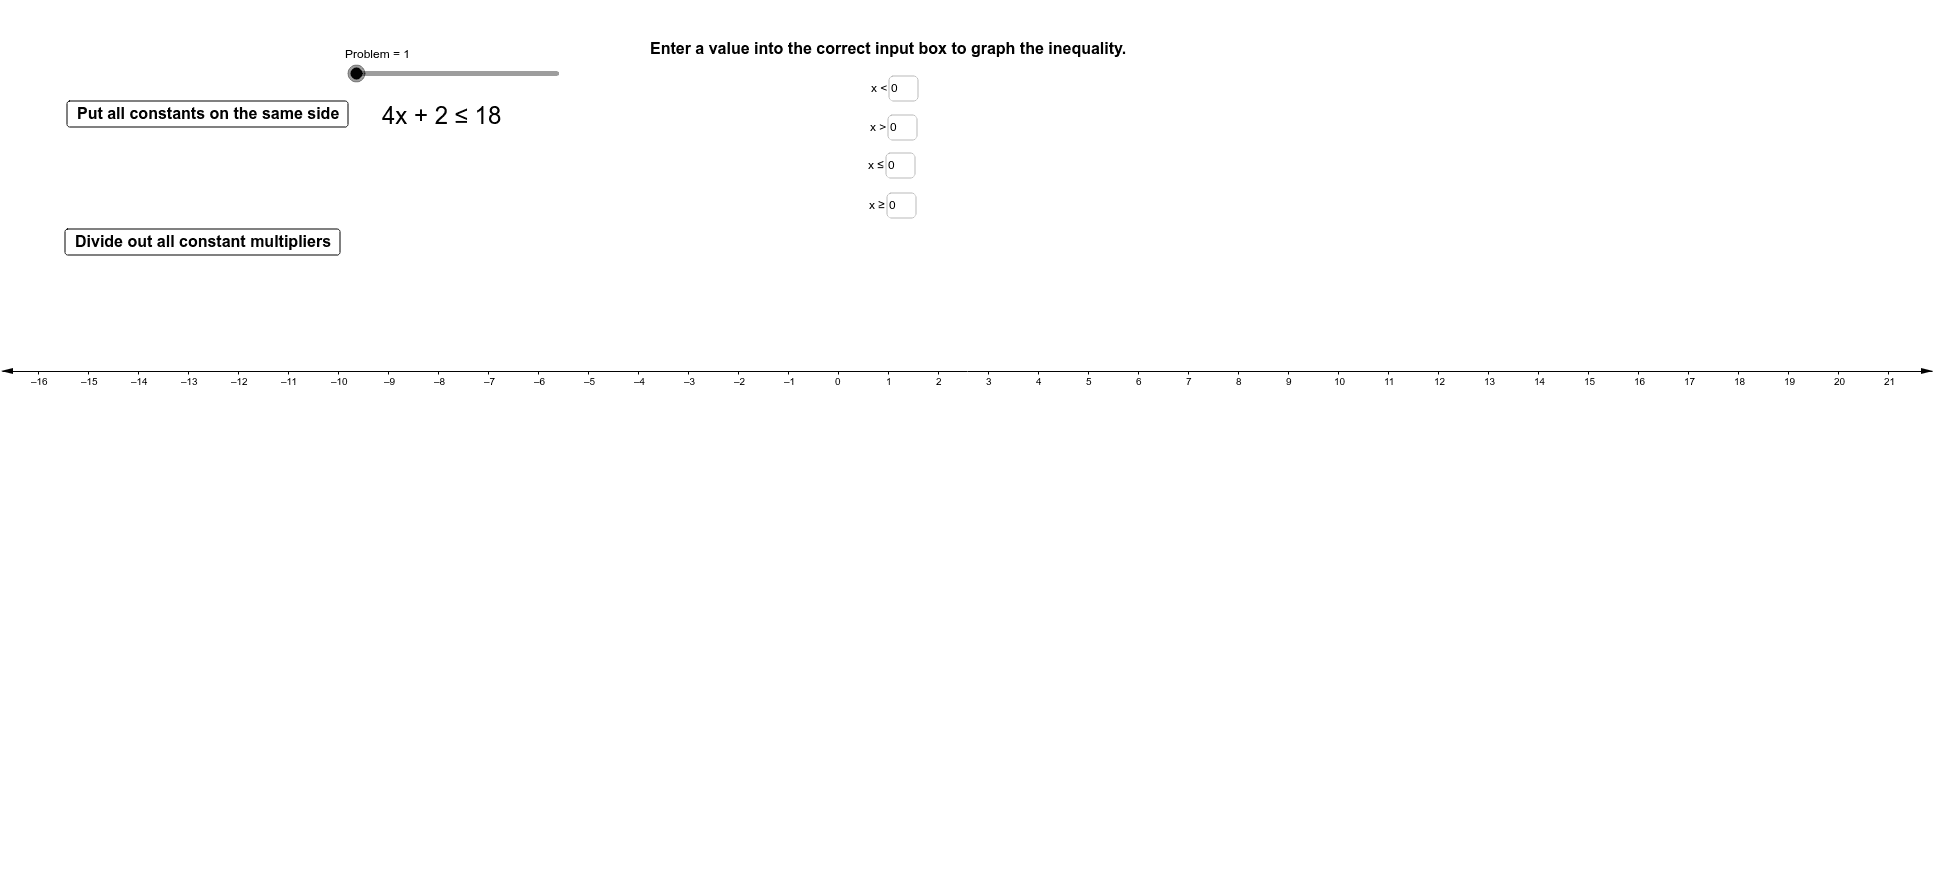
This example demonstrates how to solve simple inequalities and graph them on a number line. It involves core math concepts like inequality solving and number line representation. GeoGebra commands and objects used include Textfield, a, b, inputBox1, inputBox2, c, inputBox3, d, inputBox4, e, f, g, h, i, j, k, l, m, n, o, p, text1, Problem, text2, text3, text4, text5, text6, text7, text8, button1, text9, q, button2, text10, r, s, text11, text12, text13, t. Suitable for middle school mathematics teaching, helping students understand and master basic inequality solving and graphing techniques.
GeoGebra Commands & Parameters
Textfield(a) → inputBox1Textfield(b) → inputBox2Textfield(c) → inputBox3Textfield(d) → inputBox4
AI Drawing Prompt Reference
Draw the graph of inequality solutions on a number line, input two coefficients for inequalities, solve the inequalities based on the inputs, and represent the solution sets with different colors on the number line, marking key points and the direction of inequalities.
The prompt above was compiled from the original drawing commands and is for reference only.