
Solving Exponential Equations Visually
Loading the math board and drawing, please wait…
In collections
About Exponents
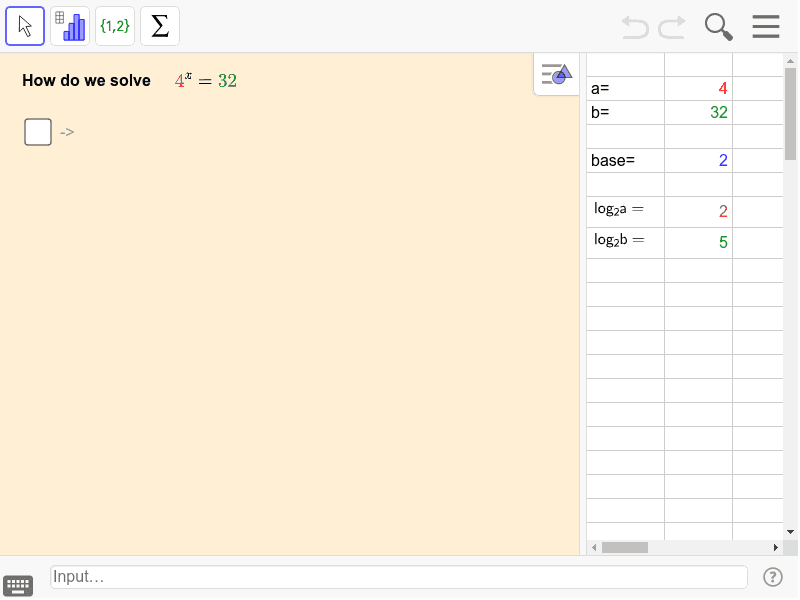
This example demonstrates solving exponential equations visually without explicitly using logarithms, explaining the function and utility of logarithms. Core math concepts include exponential functions, logarithmic principles, and equation solving. GeoGebra commands like objects n, A2, A3, A5, B2, B5, B3, B7, B8, text1, red, green, text2, blue, redlog, greenlog, text4, text5, text6, text7, text8, text9, text11, text10, text12, text13, text3, a, b, c, d, e, f, g, text14, A7, A8 are utilized. Suitable for high school and above learners to understand the relationship between logarithms and exponential functions.
GeoGebra Commands & Parameters
Numeric n(2)Numeric B2(4)nNumeric B3(32)log(B5, B2)log(B5, B3)Boolean a(false)Boolean b(false)Boolean c(false)Boolean d(false)Boolean e(false)Boolean f(false)Boolean g(false)
AI Drawing Prompt Reference
Draw an exponential function graph, showing the relationship between logarithmic and exponential functions by adjusting the base and exponent values. First, draw an exponential function graph with base 2, then draw another with base 4, and finally draw one with base 32. Use red and green to mark the intersection points of the two exponential functions, and label the definitions of logarithmic and exponential functions on the graph.
The prompt above was compiled from the original drawing commands and is for reference only.