
Solving a System of Two Linear Equations by Graphing Intersecting Lines
Loading the math board and drawing, please wait…
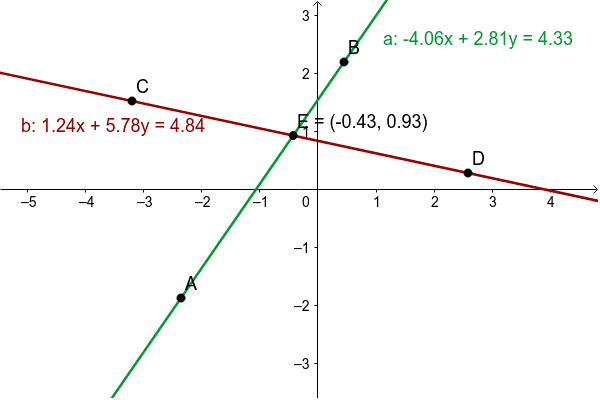
This example demonstrates how to graph two straight lines in the Cartesian plane and use their intersection point to solve a system of two linear equations in two variables, visually linking the algebraic solution to the geometric intersection. Core mathematical concepts include systems of linear equations, linear equations in two variables, unique solutions, intersecting lines, and coefficient-ratio criteria such as a₁/a ≠ b₁/b. Construction points: the GeoGebra command Line is used to draw line a through points A and B and line b through points C and D; the command Intersect is then applied to obtain the intersection point E. Relevant objects are A, B, a, C, D, b, and E. It is suitable for middle-school algebra-geometry integrated instruction and high-school analytic geometry review, serving classroom demonstrations and independent student exploration of the graphical method for solving linear systems.
GeoGebra Commands & Parameters
Line(A, B) → aLine(C, D) → bIntersect(b, a) → E
AI Drawing Prompt Reference
Please draw two lines on the Cartesian plane and use their intersection point to solve a system of two linear equations in two variables. First, draw one line through points A and B; then, draw another line through points C and D. Next, find the intersection point E of these two lines. The final figure should include both lines and their intersection point, demonstrating the link between the algebraic solution and the geometric intersection.
The prompt above was compiled from the original drawing commands and is for reference only.