
Slow Plotting a Surface of Revolution: Dynamic 3D Visualization
Loading the math board and drawing, please wait…
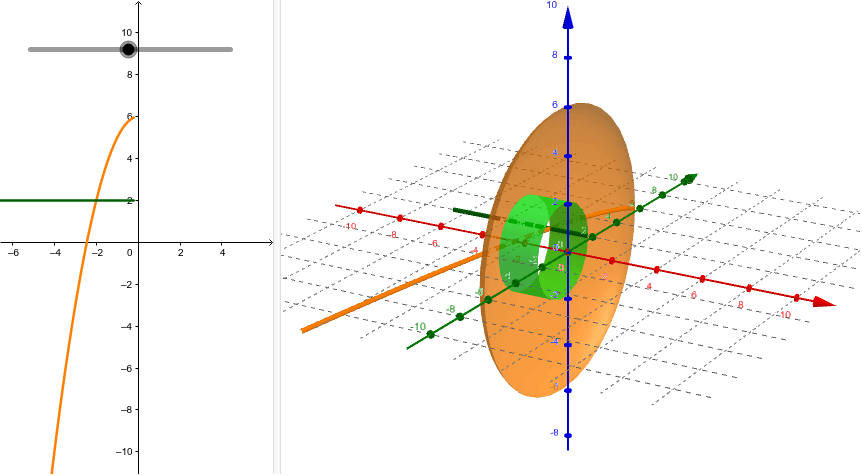
① This example demonstrates how to use GeoGebra's Surface command to revolve a plane curve around an axis, generating a 3D surface of revolution, with a 'slow plotting' feature that reveals the surface's formation step by step. ② Core mathematical concepts include surfaces of revolution, parametric equations, 3D surface construction, and connections to calculus (volume/surface area of solids of revolution). ③ Construction highlights: Based on the summary, the Surface command is used with objects a, f, b, g, c—where f and g likely define the curve or axis, and a, b, c may set parameter ranges or auxiliary controls; adjusting sliders or animation speed enables slow generation for clear visualization. ④ Suitable for high school to undergraduate courses in calculus or solid geometry, ideal for teaching the concept of rotational surfaces and as an introductory 3D modeling exercise.
GeoGebra Commands & Parameters
Surface(t, (f(t) * cos(u)), (f(t) * sin(u)), t, -2, 2, u, 0, 6.28319) → bSurface(t, (g(t) * cos(u)), (g(t) * sin(u)), t, -2, 2, u, 0, 6.283185307179586) → c
AI Drawing Prompt Reference
Create a rotating surface by revolving a plane curve around an axis, showing the dynamic formation process of the surface. Use parametric equations to define the curve and axis, and control parameter ranges and animation speed with sliders to achieve a slow plotting effect for clear visualization of the surface's formation.
The prompt above was compiled from the original drawing commands and is for reference only.