
Slope of a Line: Roller Coaster Model
Loading the math board and drawing, please wait…
In collections
Slope
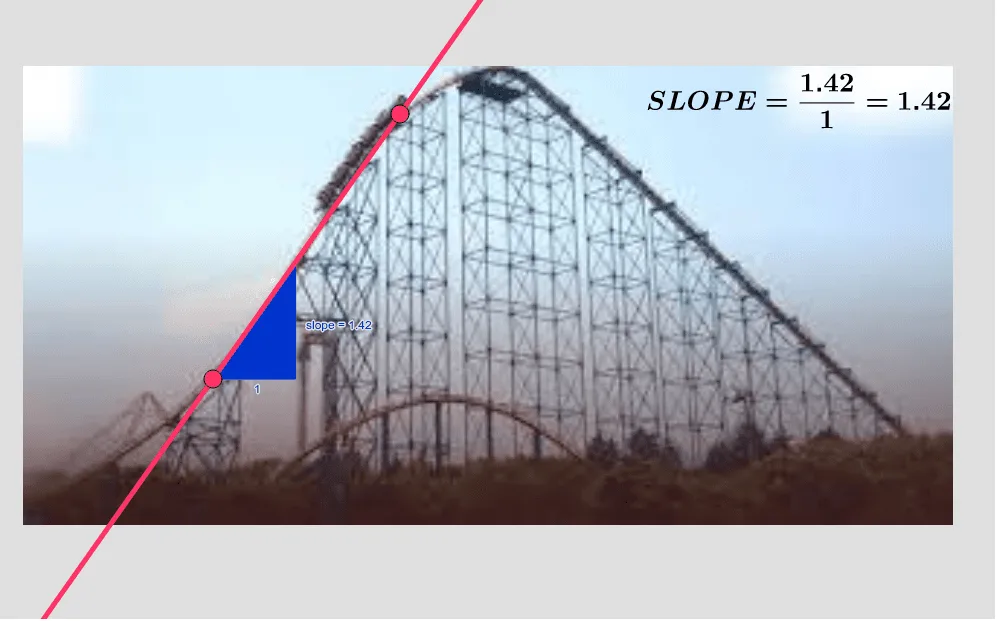
This GeoGebra example demonstrates the slope of a line through a roller coaster context, using straight track segments to visualize steepness and rate of change. The core mathematical concepts covered include coordinate geometry, the slope formula, linear functions, and the geometric meaning of slope as the ratio of vertical change to horizontal change between two points. In terms of construction, the example uses the GeoGebra Line command to create a line through points A and B, labeled as line a, and applies the Slope command to compute the slope value. Additional objects such as points C and D, a text object named text1, and an image object named pic1 are used to annotate and illustrate the relationship between slope and gradient. This resource is suitable for middle school mathematics (grades 7–9) introducing linear equations, as well as high school analytic geometry review and interactive classroom demonstrations.
GeoGebra Commands & Parameters
Line(C, D) → aSlope(a) → slope