
Graphical Approach to Simultaneous Equations and Inequalities
Loading the math board and drawing, please wait…
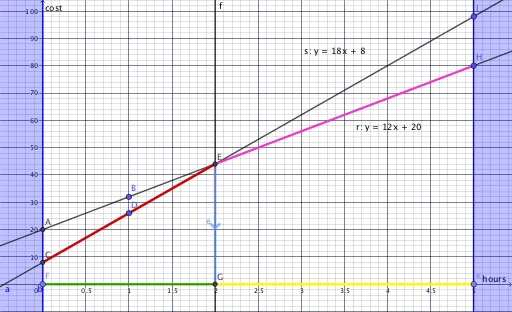
① This example demonstrates how to solve simultaneous equations and inequalities graphically by visualizing intersections and feasible regions in a dynamic geometry environment. ② Core mathematical concepts include solutions of linear equation systems, feasible regions of linear inequalities, perpendicular lines, intersections, and the combination of polygons with stochastic processes. ③ Construction details: using GeoGebra commands such as Intersect to find intersection points, OrthogonalLine to construct perpendiculars, Segment to draw segments, and Point to define key points; objects include lines r and s, points A, B, C, H, texts text1 and text2, functions f and g, and shapes F, G, h, i, K, j, e, D, I, which together illustrate solution sets via intersections and region partitioning. ④ Suitable for middle and high school mathematics teaching to understand the geometric meaning of simultaneous equations and inequalities, also useful for pre-university review or for teachers creating interactive lessons.
GeoGebra Commands & Parameters
Intersect(r, yAxis) → AIntersect(s, yAxis) → CIntersect(s, r) → EOrthogonalLine(E, xAxis) → fSegment(C, E) → gPoint(b) → FIntersect(f, xAxis) → GSegment(F, G) → hSegment(E, H) → iPoint(a) → KSegment(G, K) → jSegment(E, G) → e
AI Drawing Prompt Reference
Draw two lines r and s in a coordinate system, marking their intersections with the y-axis as points C and A, and their intersection point E. Draw a perpendicular line from E to the x-axis, marking its intersection with the x-axis as point G. Connect C and E, and draw a line segment from F to G. Mark point K, and draw line segments from G to K and from E to G. Finally, connect F to G and draw a line segment from E to H.
The prompt above was compiled from the original drawing commands and is for reference only.