
Slope Investigation
Loading the math board and drawing, please wait…
In collections
Apps for Formative Assessment Grade 10
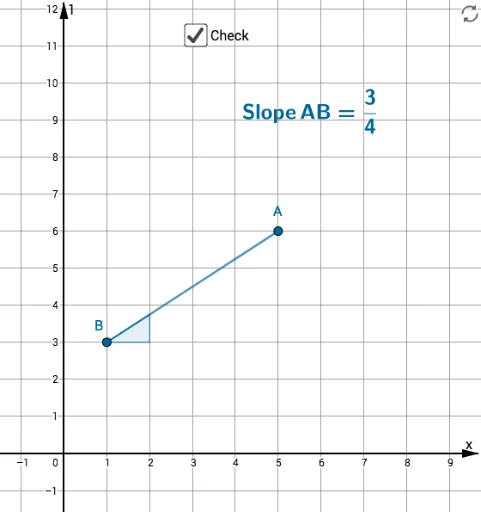
This example demonstrates the geometric phenomenon of exploring how the slope of a line changes dynamically by adjusting the positions of its endpoints. Key math concepts include slope calculation, right triangles, and function graphs (parabola). Construction highlights involve using commands like Segment, Slope, and FractionText from GeoGebra. Suitable for high school students to understand the relationship between slope and the lengths of sides in right triangles, as well as dynamic changes in function graphs.
GeoGebra Commands & Parameters
Segment(A, B) → fSlope(f) → riseSegment(B, A) → gSlope(g) → RiseFractionText(m) → text2
AI Drawing Prompt Reference
Draw a line segment, calculate and display its slope, then draw the reverse of this segment and calculate its slope, finally label the two slope values in fraction form on the graph to show the relationship between the slope and the positions of the endpoints and its dynamic changes.
The prompt above was compiled from the original drawing commands and is for reference only.