
Slope-Intercept Form Generator and Graph
Loading the math board and drawing, please wait…
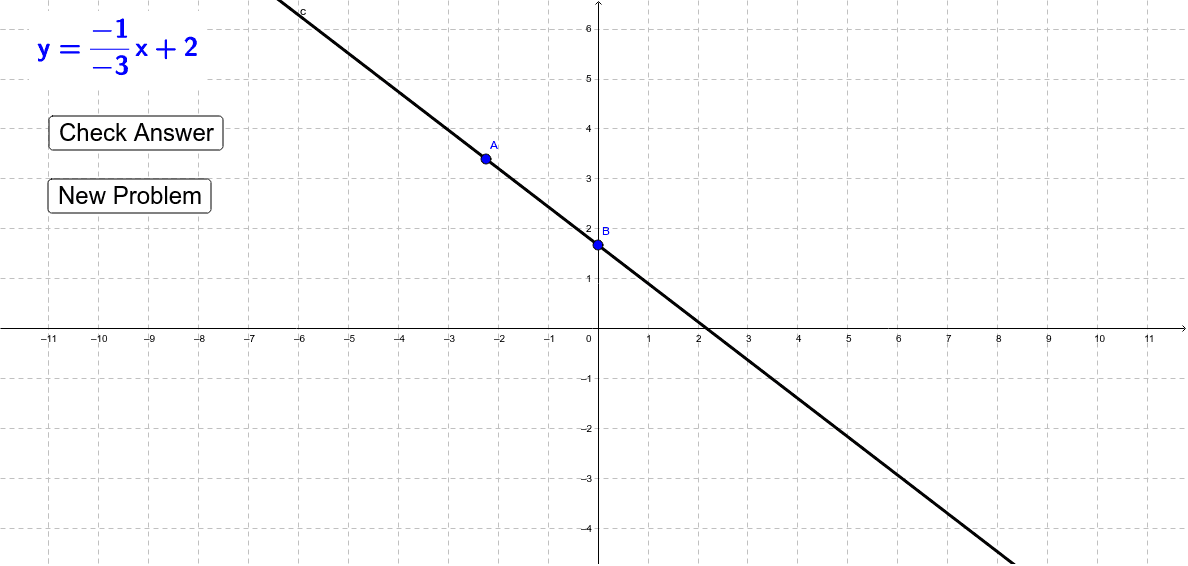
This example demonstrates generating linear equations in slope-intercept form (y=mx+b) and plotting their graphs. It involves core math concepts like slope-intercept form, coordinate geometry, and linear graph representation. Construction highlights include using the Line command, parameters n, d, b, displaying equations with text1, interactive plotting via button1, and auxiliary objects a, show, A, B, c, button2. Suitable for high school mathematics education, enhancing visual learning of linear equations and their graphical interpretations.
GeoGebra Commands & Parameters
Line(A, B) → c
AI Drawing Prompt Reference
Draw a line representing a linear equation in slope-intercept form y=mx+b, where m and b are adjustable parameters. The line passes through two points, one on the x-axis and one on the y-axis, with their coordinates labeled. Use a button to plot the line based on the current values of m and b, and clearly display the equation on the graph.
The prompt above was compiled from the original drawing commands and is for reference only.