
Point-Slope Form Line Equation Generator
Loading the math board and drawing, please wait…
In collections
Linear equations
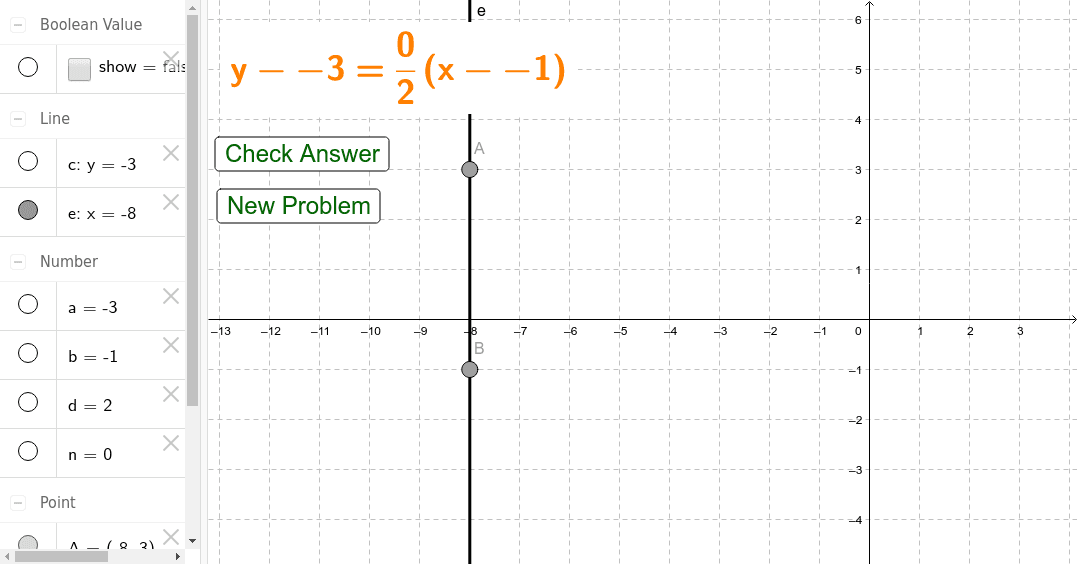
This example demonstrates how to dynamically plot the graph of a point-slope form linear equation. It involves core mathematical concepts such as the point-slope equation, slope of a line, y-intercept, and basic analytical geometry plotting techniques. Key construction elements include the GeoGebra commands/objects: Line (for drawing lines), parameters a, b, n, d, text1 (for text display), buttons button1, button2 (for control), points c, A, B, e (for auxiliary coordinates), and show (for display control). Suitable for high school students learning and understanding the plotting of linear equations and the effects of parameter changes.
GeoGebra Commands & Parameters
Line(A, B) → e
AI Drawing Prompt Reference
Draw a line through two points and display an auxiliary coordinate point on the line.
The prompt above was compiled from the original drawing commands and is for reference only.