
Slope Concept
Loading the math board and drawing, please wait…
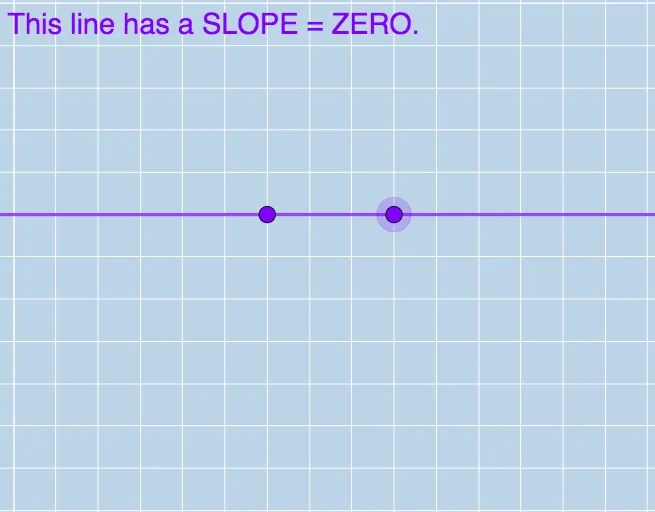
This example illustrates the concept of the slope of a line. By constructing a line through points A and B, and calculating its slope using GeoGebra commands such as PointIn, Line, and Slope, the dynamic change in slope can be demonstrated. Suitable for students in middle school and above to learn about linear equations and slope.
GeoGebra Commands & Parameters
PointIn(a) → BLine(A, B) → fSlope(f) → bLine(A, B) → gLine(A, B) → hLine(B, A) → i
AI Drawing Prompt Reference
On a coordinate plane, place two points A and B. Construct a main line passing through A and B, and include the quantity representing that line’s slope. Then draw additional lines determined by the same two points so that several lines through A and B appear in the figure, including a version obtained when the point order is swapped. Keep the relationships tied only to A and B so the slope concept can be compared visually across the constructed lines.
The prompt above was compiled from the original drawing commands and is for reference only.