
Slippery surface 04:Geometric Construction and Optimization
Loading the math board and drawing, please wait…
In collections
Slippery surface
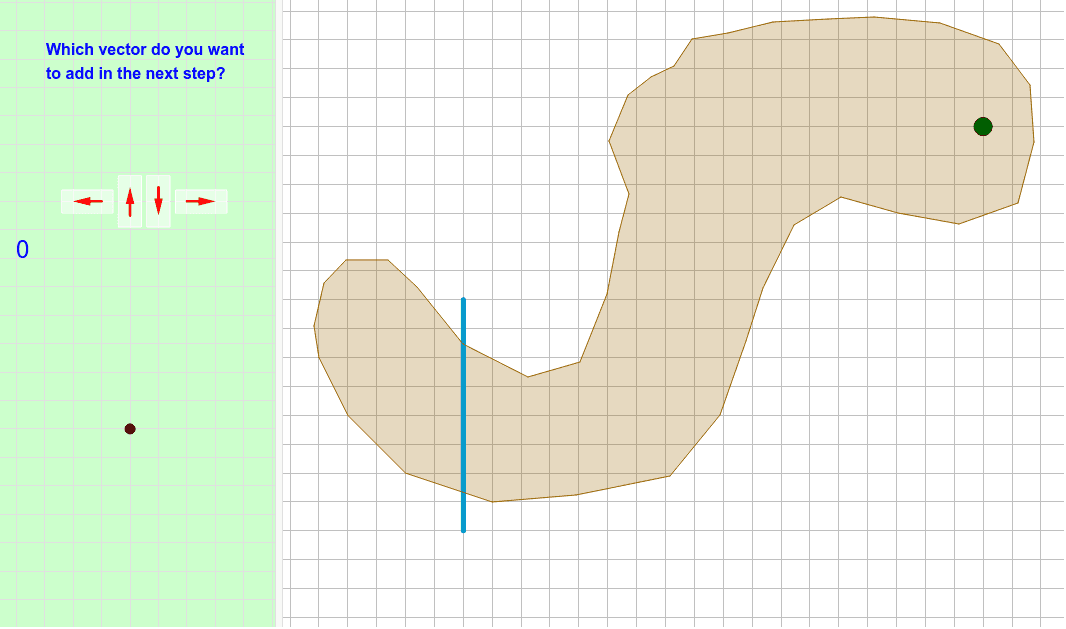
This example demonstrates geometric construction and optimization problems. Key mathematical concepts include derivatives, linear programming, and solid geometry. Construction involves using GeoGebra commands like Polygon, Segment, Intersect, and multiple geometric objects. Suitable for high school students or college undergraduates learning geometry and optimization techniques.
GeoGebra Commands & Parameters
Polygon(E, F, B, N, O, R, S, T, U, V, W, Z, G, A_1, B_1, C_1, D_1, E_1, F_1, G_1, H_1, I_1, J_1, H, K_1, L_1, M_1, N_1, O_1, P_1, Q_1, R_1, I, J, K, L, M, A) → camino, c, m, p, q, i_1, s_1, t_1, c_2, d_2, e_2, f_2, d, g_2, h_2, j_2, k_2, l_2, m_2, n_2, p_2, q_2, r_2, e, s_2, t_2, a_3, b_3, c_3, d_3, e_3, f_3, g_3, f, g, h, j, k, lSegment(Q, P) → segmentoIntersect(segmento, camino) → corte, corte_1, corte_2, corte_3Segment(C, D) → llegadaIntersect(llegada, segmento) → corteganadorVector(ejemplo, ejemplopunta) → ejemplovectorPolyLine(listarastro) → rastroVector(controles + (1, 1), controles + (0, 1)) → izqVector(controles + (2, 0.5), controles + (2, 1.5)) → arrVector(controles + (3, 1.5), controles + (3, 0.5)) → abaVector(controles + (4, 1), controles + (5, 1)) → derVector(ejemplo, puntoexplicado) → vectorexplicado_1Vector(puntoexplicado, ejemplopunta) → vectorexplicado_2Vector(P, P + (i * (Q - P))) → segmentovisiblePolygon((0, 0), (0.8, 0), (0.8, 1.8), (0, 1.8)) → rectangulito, rectangulito_2, rectangulito_3, rectangulito_4, rectangulito_5Translate(Rotate[rectangulito, 90*°], controles + (5.4, 0.6)) → der_FTranslate(rectangulito, controles + (2.6, 0.1)) → aba_FTranslate(rectangulito, controles + (1.6, 0.1)) → arr_FTranslate(Rotate[rectangulito, 90*°], controles + (1.4, 0.6)) → izq_F
AI Drawing Prompt Reference
Draw a graphic with multiple geometric objects. First, draw a rectangle, then rotate and translate it. Next, draw some line segments and vectors that intersect with the rectangle. Finally, draw arrows and vectors to show their relationships. Ensure the graphic is clear and easy to understand.
The prompt above was compiled from the original drawing commands and is for reference only.