
Sliding Roots: How Area Changes as the Graph Translates
Loading the math board and drawing, please wait…
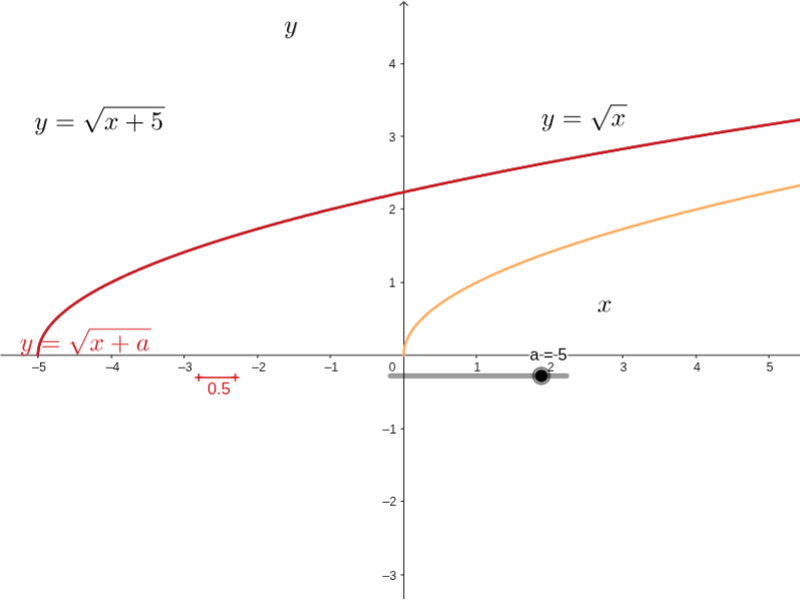
① This example demonstrates how the area between a function graph and the x-axis changes when the graph is translated parallel to the x-axis, controlled by a slider. ② Core mathematical concepts include definite integrals, function translation, area as a function of a parameter, and connections to expected value and random variables (as hinted by original tags). ③ Construction uses GeoGebra commands: Segment for line segments, Integral for computing the definite integral area; objects include functions f and g, text labels text1–text5, sliders a and h, points P and Q, and parameters k, b, c, e, d, j, i. The slider h shifts the graph horizontally, and the area value updates dynamically. ④ Suitable for high school to early college students, this interactive tool helps visualize the geometric meaning of integrals, the effect of transformations on area, and serves as a teaching aid for calculus or probability concepts involving shifted random variables.
GeoGebra Commands & Parameters
Segment(P, Q) → kIntegral(g, -4, -2) → bIntegral(f, 1, 3) → cIntegral(f, 2.2, 2.7) → eIntegral(h, 1 - a, 3 - a) → dIntegral(h, 2.2 - a, 2.7 - a) → jIntegral(g, -2.8, -2.3) → i