
Sketching Curve of Quadratic Functions
Loading the math board and drawing, please wait…
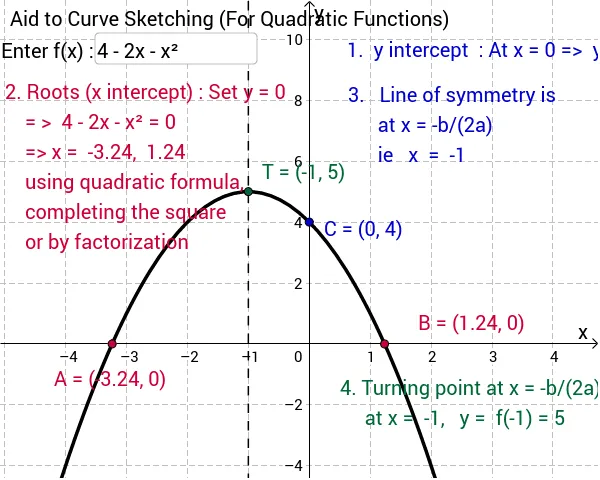
① This interactive GeoGebra example demonstrates how to sketch the curve of a quadratic function and observe how changing parameters affects the parabola's shape in real time. ② Core mathematical concepts include the standard form of quadratic functions, vertex, axis of symmetry, roots (zeros), and extrema, along with translations and scaling of function graphs. ③ Construction highlights: the Root command finds the x-intercepts, Extremum locates the vertex, and a Textfield with an input box (inputBox1) allows users to dynamically enter coefficients like 'a', updating the function f and its graph; objects include text labels (text1 to text5), points A, B, T, C, and sliders. ④ Suitable for classroom presentations or student self-directed learning (drill and practice), especially for middle and high school students studying quadratic function properties, helping them intuitively grasp how coefficients influence the graph's position and shape.
GeoGebra Commands & Parameters
Root(f) → A, BExtremum(f, -1000, 1000) → TTextfield(f) → inputBox1
AI Drawing Prompt Reference
Draw the graph of a quadratic function as a parabola, showing its x-intercepts, vertex, and axis of symmetry. Include an interactive input box to dynamically adjust the leading coefficient, which changes the parabola's direction, width, and position in real time. Label the key points: the two roots (where the parabola crosses the x-axis), the vertex (maximum or minimum point), and other reference points on the curve. When the coefficient is changed via the input box or slider, the parabola and its labeled points should update simultaneously, illustrating how parameter changes affect the graph's shape.
The prompt above was compiled from the original drawing commands and is for reference only.