
Sketching a Sine Function Graph
Loading the math board and drawing, please wait…
In collections
CCGPS AA Unit 6 Lesson 1
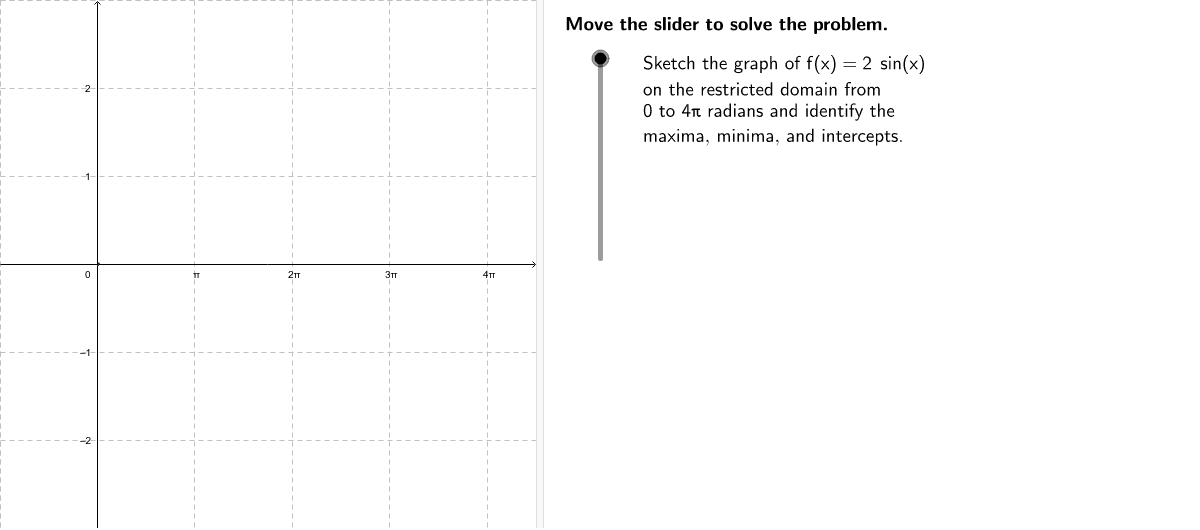
This example demonstrates hand sketching the graph of the sine function f(x) = 2sin(x) over the restricted domain from 0 to 4π radians. It involves core math concepts like sine function properties, amplitude, period, maxima, and minima. The construction leverages GeoGebra commands and objects such as Corner, Function, Sequence, Join, and TableText for plotting, connecting points, and generating sequences. Suitable for high school students and teachers learning about sine function graphs and their characteristics.
GeoGebra Commands & Parameters
Corner(3) → C3Corner(1) → C1Corner(4) → C4Corner(2) → C2Function(f, 0, (multiples * π)) → f1Sequence(((((1 + (4 * n)) * π)) / 2, amplitude), n, 0, multiples / 2 - 0.25, 1) → maxesJoin({Sequence[",", n, 0, multiples / 2 - 1.25], {""}}) → maxescommasTableText({Sequence["(\frac{" + (1 + (4 * n)) + " \pi}{2}," + amplitude + ")" + (Element[maxescommas, n + 1]), n, 0, multiples / 2 - 0.25]}) → maxstringJoin({Sequence[",", n, 0, multiples / 2 - 1.75], {""}}) → minscommasTableText({Sequence["(\frac{" + (3 + (4 * n)) + " \pi}{2}," + ((-amplitude)) + ")" + (Element[minscommas, n + 1]), n, 0, multiples / 2 - 0.75]}) → minstringJoin({Sequence[",", n, 0, multiples - 1], {""}}) → interceptcommasTableText({Sequence["(" + (n) + " \pi, 0)" + (Element[interceptcommas, n + 1]), n, 0, multiples]}) → interceptstring
AI Drawing Prompt Reference
Draw a hand-sketched graph of the sine function f(x) = 2sin(x) over the domain from 0 to 4π radians, highlighting amplitude, period, maxima, and minima. First, mark key points including mid-period points, maxima, and minima, label their coordinates with text separated by commas. Finally, connect these points sequentially with line segments to form a smooth sine wave.
The prompt above was compiled from the original drawing commands and is for reference only.