
Six Trig Graphs from Unit Circle
Loading the math board and drawing, please wait…
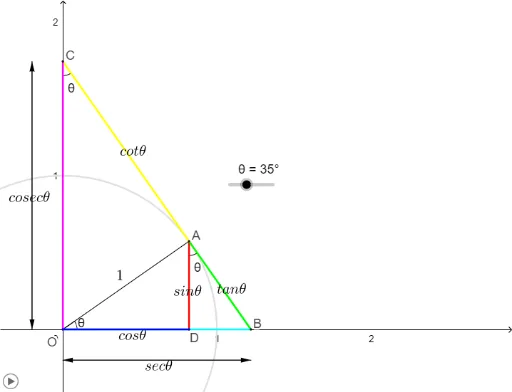
This example demonstrates the graphs of six trigonometric functions (sine, cosine, tangent, cosecant, secant, cotangent) derived from the unit circle, highlighting their periodicity, amplitude, and phase relationships. Key mathematical concepts include the unit circle, trigonometric functions, and their graphical representations. The construction utilizes GeoGebra commands such as Intersect, Circle, Rotate, Angle, Segment, Tangent, Vector, and Midpoint. It is suitable for high school and advanced learners studying trigonometry and function graphing.
GeoGebra Commands & Parameters
Intersect(xAxis, yAxis) → OCircle(O, 1) → cRotate(B_1, θ, O) → AAngle(B_1, O, A) → βSegment(O, A) → aSegment(A, D) → bSegment(O, D) → dTangent(A, c) → e,Intersect(e, yAxis) → CIntersect(e, xAxis) → BAngle(O, C, A) → γAngle(D, A, B) → δSegment(C, A) → fSegment(A, B) → B_2Vector(E, F) → uVector(F, E) → vVector(H, G) → wVector(G, H) → gMidpoint(B_2) → LMidpoint(f) → MMidpoint(b) → NMidpoint(d) → PMidpoint(a) → KSegment(C, O) → hSegment(O, B) → i