
SIR Epidemic Model Dynamic Simulation
Loading the math board and drawing, please wait…
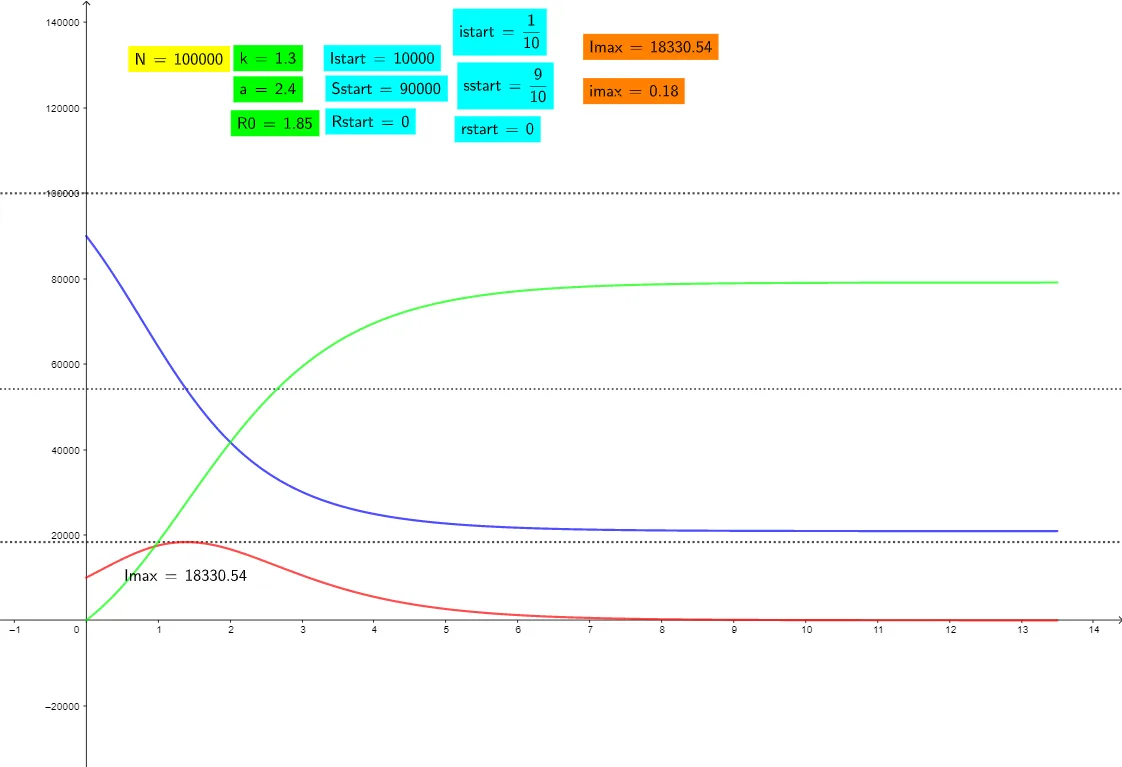
This GeoGebra example dynamically simulates the classic SIR epidemic model, illustrating the time evolution of three population compartments: Susceptible (S), Infected (I), and Recovered (R). The core mathematical concept is a system of ordinary differential equations, solved numerically using the NSolveODE command<|begin▁of▁file|>. Key parameters such as transmission rate (a), recovery rate (k), and initial values (Sstart, Istart, Rstart) are controlled via sliders, allowing exploration of the basic reproduction number R0 and its impact on outbreak dynamics. The construction uses GeoGebra's differential equation solver, dynamic text objects to display metrics like peak infection (Imax), and plots the three curves simultaneously. This resource is suitable for high school to university courses in mathematics, epidemiology, or mathematical biology, helping students understand epidemic spread, threshold phenomena, and parameter sensitivity.
GeoGebra Commands & Parameters
LaTeX(R0, true, true) → tekst4NSolveODE({S', I', R'}, 0, {Sstart, Istart, Rstart}, maxT) → S, I, RLaTeX(a, true, true) → tekst6LaTeX(k, true, true) → tekst7LaTeX(N, true, true) → tekst8LaTeX(Istart, true, true) → tekst9LaTeX(Sstart, true, true) → tekst10LaTeX(istart, true, true) → tekst11LaTeX(sstart, true, true) → tekst12LaTeX(Imax, true, true) → tekst13LaTeX(Imax, true, true) → tekst14LaTeX(Rstart, true, true) → tekst16LaTeX(rstart, true, true) → tekst17LaTeX(imax, true, true) → tekst15
AI Drawing Prompt Reference
Create a dynamic simulation of the classic SIR epidemic model showing the time evolution of Susceptible (S), Infected (I), and Recovered (R) populations. Use sliders to control transmission rate (a), recovery rate (k), and initial values (Sstart, Istart, Rstart), and calculate the basic reproduction number R0. Plot three curves simultaneously for the populations, dynamically display the peak infection value Imax, and label key parameters and initial values with text.
The prompt above was compiled from the original drawing commands and is for reference only.