
Single Graph Transformations
Loading the math board and drawing, please wait…
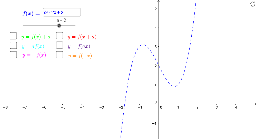
This example demonstrates dynamic effects and geometric significance of single graph transformations. It involves core math concepts like function graphs, geometric transformations, linear regression, polygons, fractions, and centroids. Construction uses GeoGebra commands/objects such as Textfield, f, a, i, j, l, m, n, inputBox2, text1, text2, text3, text4, text5, text6, text7, b, c, d, e, g, h, k. Suitable for high school mathematics teaching and function transformation learning.
GeoGebra Commands & Parameters
Textfield(f) → inputBox2
AI Drawing Prompt Reference
Draw a graph that demonstrates function transformations. The graph should include elements such as function graphs, geometric transformations, linear regression, polygons, fractions, and centroids. The construction order should start with drawing the function graph, then applying geometric transformations, followed by linear regression analysis, drawing polygons and fractions, and finally determining the centroids. Ensure the graph clearly shows the relationships between these mathematical concepts, suitable for high school mathematics teaching.
The prompt above was compiled from the original drawing commands and is for reference only.