
Singapore's 2012 Tax Rate for Varying Chargeable Income
Loading the math board and drawing, please wait…
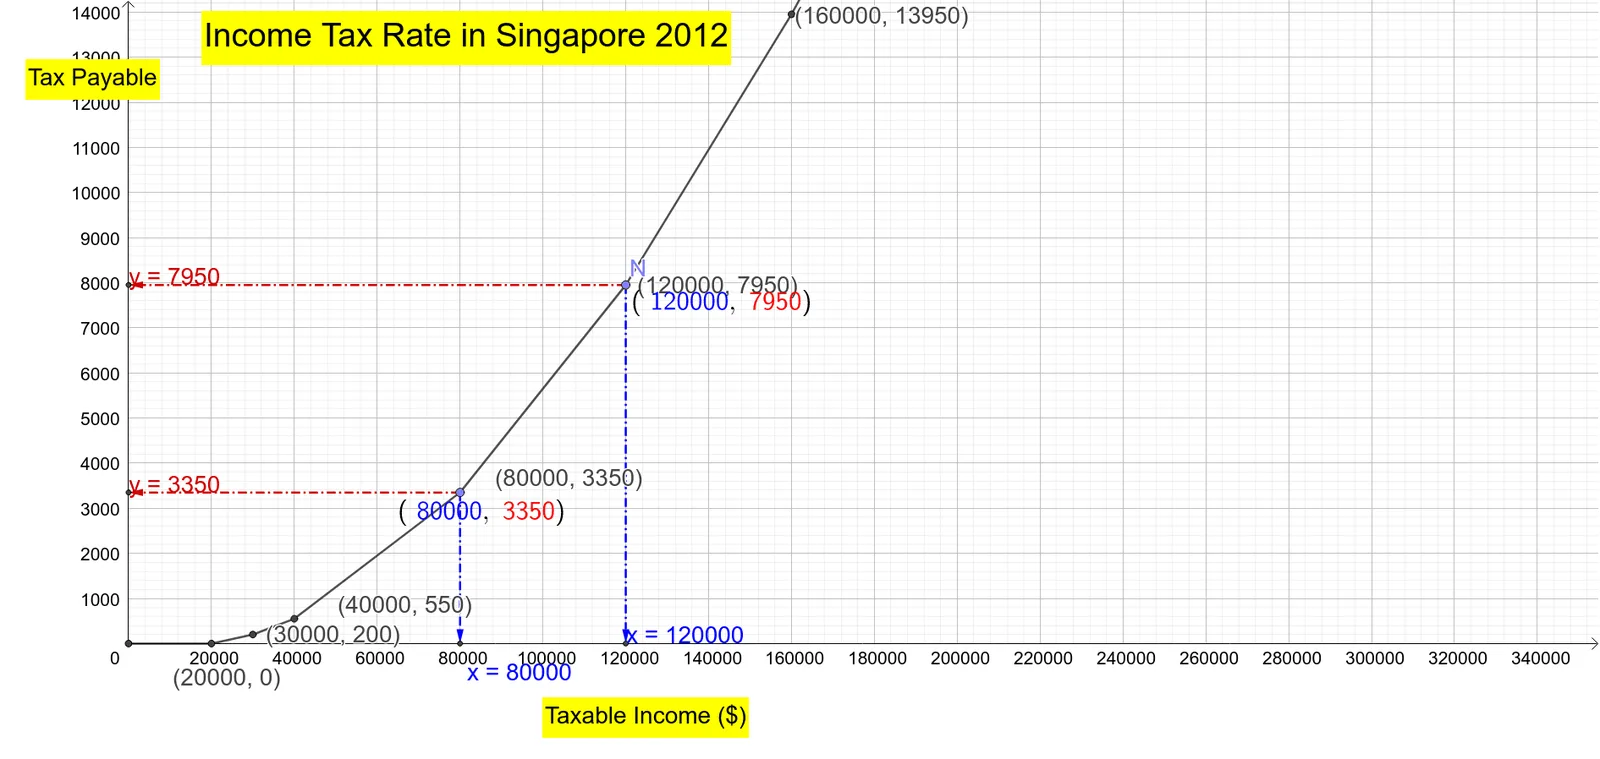
This example graphically represents the tax rates for varying chargeable income in Singapore in 2012. Key mathematical concepts include function graphs and coordinate geometry. Using GeoGebra commands such as Segment, Slope, and Point, the example demonstrates the tax rate changes for different income levels. Suitable for high school mathematics education and learning.
GeoGebra Commands & Parameters
Segment(A, B) → fSegment(B, C) → gSegment(C, D) → hSegment(D, E) → iSegment(E, F) → jSegment(F, G) → kSegment(G, H) → lSegment(H, I) → mSegment(I, J) → nSlope(n) → m_1Point(i) → KCoordPointertoAxes7a(K) → u, v, text1, text2, text3, text4, text5, L, MPoint(k) → NCoordPointertoAxes7a(N) → w, a, text9, text10, text11, text12, text13, O, P
AI Drawing Prompt Reference
Draw the tax rate graph for varying chargeable income in Singapore in 2012. Create line segments with different slopes from the lowest to the highest income, indicating the tax rate changes. Label the tax rate and income range at the end of each segment.
The prompt above was compiled from the original drawing commands and is for reference only.