
Sine Wave Transformations
Loading the math board and drawing, please wait…
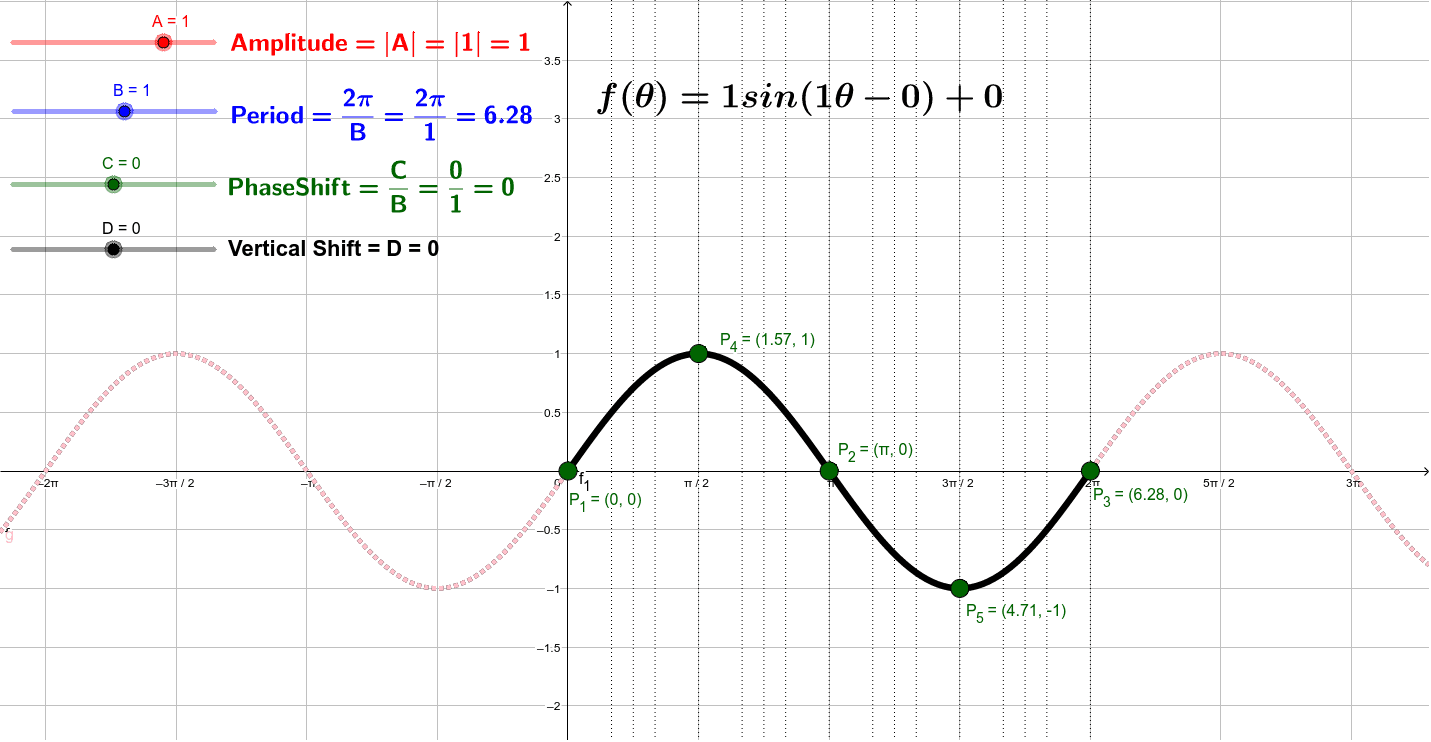
This example demonstrates transformations of sine waves, involving core concepts of trigonometry. By adjusting parameters, one can observe translations, scalings, and rotations of the sine wave. The construction summary mentions the use of functions, vectors, and slider animations in GeoGebra. Suitable for high school mathematics education and students learning about sine function transformations.
GeoGebra Commands & Parameters
Numeric A(1.0)Numeric B(1.0)Numeric C(0.0)C / BNumeric D(0.0)f(x) = (A * sin((B * x) - C)) + Dg(x) = sin(x)x = π / 4x = π / 3x = π / 2x = (2 * π / 3)x = (3 * π / 4)x = (5 * π / 6)x = (7 * π / 6)x = (5 * π / 4)x = (4 * π / 3)x = πx = (3 * π / 2)x = (7 * π / 4)x = (5 * π / 3)x = (11 * π / 6)x = (2 * π)abs(A)(2 * π / B)abs(A)(C', f(C'))(C' + B', f(C' + B'))(C' + B' / 4, f(C' + B' / 4))(C' + (3 * B' / 4), f(C' + (3 * B' / 4)))f_1(x) = If[x(P_1) ≤ x ≤ x(P_3), f]x = π / 6(C' + B' / 2, f(C' + B' / 2))
AI Drawing Prompt Reference
Draw a sine wave and its transformations to illustrate the effects of parameter adjustments on the sine wave. Start by plotting the basic sine wave, then adjust the amplitude, frequency, phase, and vertical displacement parameters to show translations, scalings, and rotations of the wave. Mark key phase points on the graph and differentiate the original and transformed waves with different colors or line styles. Finally, use animations to demonstrate how changes in parameters affect the wave.
The prompt above was compiled from the original drawing commands and is for reference only.