
Sine Wave Demonstration and Sound Playback
Loading the math board and drawing, please wait…
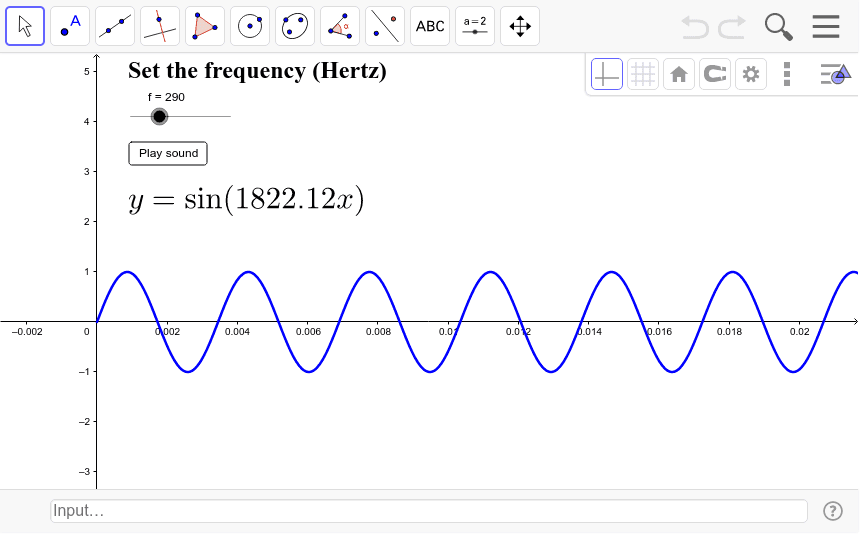
This example demonstrates the change in the sine wave graph as the frequency is adjusted, and allows corresponding sound playback via a button. Core math concepts include sine function, frequency, and waveform transformation. It uses GeoGebra's Function command for graphing, button object for sound control, slider for frequency adjustment, and text objects for instructions. Suitable for high school students learning trigonometric functions, function graph transformations, and the relationship between sound and waveforms, ideal for classroom teaching or self-learning.
GeoGebra Commands & Parameters
Function(sin((((2 * π) * f) * x)), 0, (10 * π / f)) → h