
Sine Function Graphing
Loading the math board and drawing, please wait…
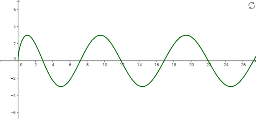
This example demonstrates how to use the Equation Editor in the GeoGebra mobile app to graph a sine function. The sine function is a type of trigonometric function, and its graph exhibits a periodic wave pattern. By adjusting the function parameters, one can observe the changes in the sine function's graph. The example uses the function object f in GeoGebra to create the graph. Suitable for high school mathematics education and learning.
GeoGebra Commands & Parameters
f(x) = (3 * sin(x / 2 + sqrt(x)))