
Phone-friendly Linear Equation Graphing
Loading the math board and drawing, please wait…
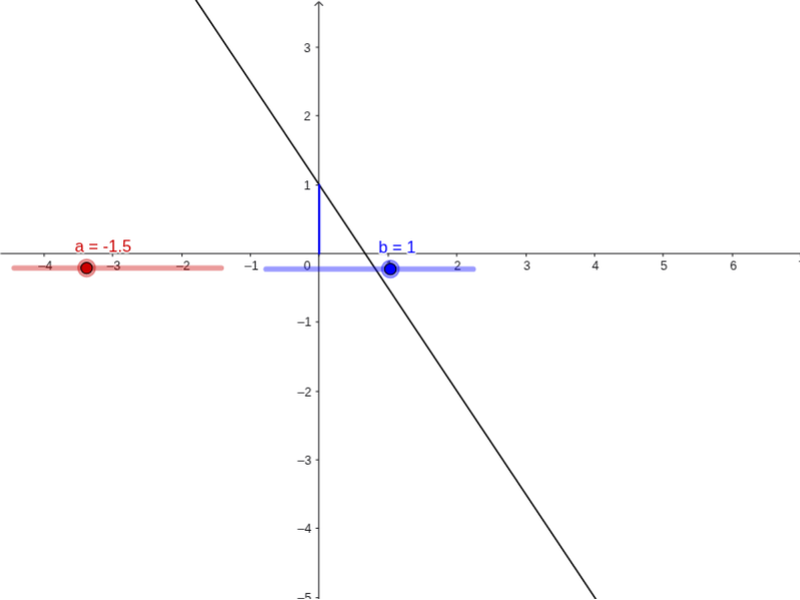
This interactive GeoGebra demonstration illustrates how the linear function y = mx + b changes as parameters m (slope) and b (y-intercept) vary. Using GeoGebra commands Slope (to calculate line slope), Intersect (to find axis intersections), and Segment (to draw key line segments), students can dynamically explore: (1) How slope m determines the line's direction and steepness; (2) How intercept b positions the line on the y-axis; (3) The behavior of lines with positive, negative, and zero slopes. The phone-friendly design ensures smooth interaction on mobile devices. Ideal for middle school mathematics teaching of linear functions, suitable for classroom demonstration or student self-directed learning to deepen understanding of function graphs and parameter relationships.
GeoGebra Commands & Parameters
Slope(c) → mIntersect(xAxis, yAxis) → AIntersect(c, yAxis) → BSegment(A, B) → d
AI Drawing Prompt Reference
Draw a line with a variable slope m and y-intercept b. First, calculate the slope m, then find the intersection points of the x-axis and y-axis, labeled as point A, and the intersection of the line and the y-axis, labeled as point B. Finally, draw a line segment connecting points A and B.
The prompt above was compiled from the original drawing commands and is for reference only.