
Sine Function Geometric Representation
Loading the math board and drawing, please wait…
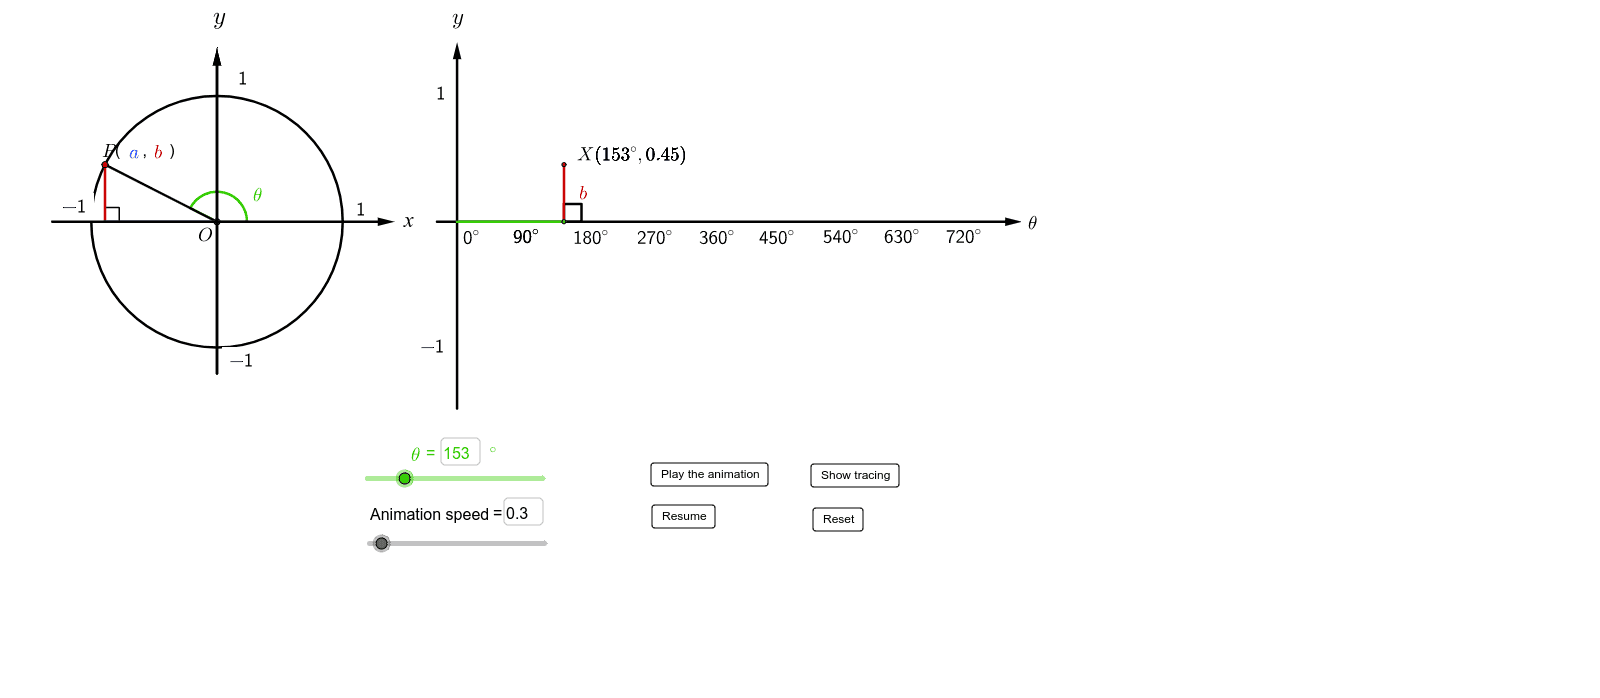
This example demonstrates the geometric representation of the sine function. It involves the core mathematical concept of trigonometry. Using GeoGebra commands such as Segment, Circle, Intersect, etc., the sine function's graph can be constructed. Suitable for high school mathematics education, helping students understand the properties and graph characteristics of the sine function.
GeoGebra Commands & Parameters
Segment(O, B_1) → h_1Circle(O, 3.141592653589793) → cIntersect(c, h_1) → D_1,Rotate(D_1, x(W), O) → A_2Intersect(xAxis, yAxis) → OriginSegment(Origin, O) → hIntersect(c, h) → D,OrthogonalLine(D, xAxis) → c_1Rotate(D, x(W), O) → AOrthogonalLine(A, xAxis) → gIntersect(g, xAxis) → BSegment(B, O) → kSegment(O, A) → bIntersect(b, k) → ESegment(A_2, O) → b_1Intersect(b_1, c_1) → FOrthogonalLine(Origin, xAxis) → dOrthogonalLine(Origin, d) → fPoint(xAxis) → GRay(Origin, G) → mAngle(D, O, A) → βTextfield(Θ) → inputBox1Segment(O, D) → aOrthogonalLine(A, a) → eSegment(A, B) → jSegment(W, Origin) → nSegment(X, W) → qSegment(W, Y) → sSegment(W, Z) → tAngle(A, B, O) → γSegment(F, D) → d_1Segment(F, A) → e_1Midpoint(q) → HMidpoint(s) → IMidpoint(t) → SSegment(B, O) → pPoint(yAxis) → PPoint(yAxis) → QVector(P, Q) → uPoint(u) → RPoint(xAxis) → TTextfield(speed) → inputBox2Angle(T, W, X) → δAngle(T, W, Y) → εVector(U, V) → zVector(A_1, B_1) → u_1Vector(A_1, B_1) → v_1Vector(C_1, T) → vVector(V, U) → z_1Segment(A_2, Y) → I_1Angle(D_1, O, A_2) → β_1OrthogonalLine(A_2, xAxis) → g_1Intersect(g_1, xAxis) → B_2Segment(A_2, B_2) → a_1Angle(A_2, B_2, O) → γ_1If(f_1 ≟ 1, true, false) → FAIf(f_1 ≟ 0, true, false) → FBPolygon(E_1, F_1, G_1, H_1) → poly1, e_2, f_2, g_2, h_2
AI Drawing Prompt Reference
Draw the geometric representation of the sine function. Start by drawing the unit circle and the x-axis, then use rotation and intersection to find the points corresponding to the sine values, and finally draw the graph of the sine function. Specifically, draw the unit circle, x-axis, and origin, use rotation and intersection to find the points corresponding to the sine values, and then draw the sine function's graph.
The prompt above was compiled from the original drawing commands and is for reference only.