
Sine Function Animation by Arthur Lee
Loading the math board and drawing, please wait…
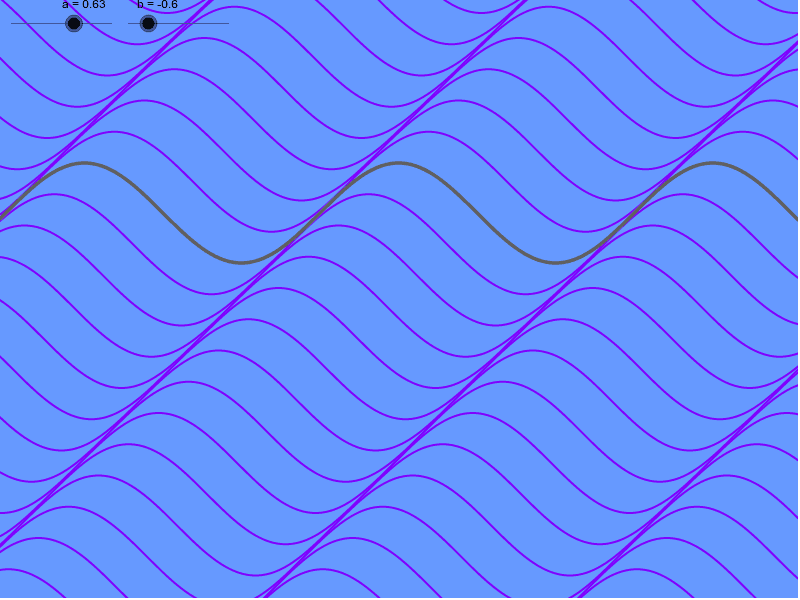
This example demonstrates the animation of a sine function graph. It involves core math concepts like trigonometry, unit circle, function graphing, addition, indefinite integral, and reflection. Constructed using GeoGebra commands such as Sequence with objects f, a, b, and list1. Ideal for high school mathematics teaching and function graph learning.
GeoGebra Commands & Parameters
Sequence(a * n + sin(x + b * n), n, -30, 30) → list1
AI Drawing Prompt Reference
Create an animation of a sine function graph showing the dynamic process of the sine wave image changing with parameters from -30 to 30, using a sequence to generate multiple overlapping sine waves to illustrate core concepts of trigonometry and function graphing.
The prompt above was compiled from the original drawing commands and is for reference only.