
Sine Cosine Tangent to 90
Loading the math board and drawing, please wait…
In collections
Right Angled Triangles
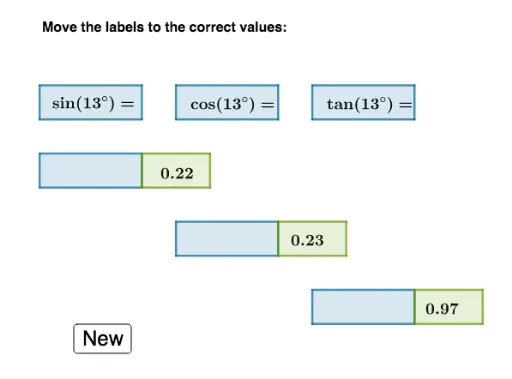
This example demonstrates the behavior and relationships among sine, cosine, and tangent functions within the range of 0 to 90 degrees. Key math concepts include trigonometric definitions, unit circle, and right triangle side-angle relationships. GeoGebra commands like Shuffle, Element, Polygon, Point, Centroid, and IsInRegion are used to create dynamic visualizations and interactions. Suitable for high school mathematics education to help students intuitively grasp the properties and geometric significance of trigonometric functions.
GeoGebra Commands & Parameters
Shuffle(list1) → list2Element(list2, 1) → pElement(list2, 2) → qElement(list2, 3) → rPolygon(A, B, C, D) → q1, a_1, b_1, c_1, dPolygon(E, F, G, H) → q2, e, f, g, hPolygon(I, J, K, L) → q3, i, j, k, lPolygon(M, N, O, P) → q4, m, n, o, p_1Polygon(Q, R, S, T) → q5, q_1, r_1, s, tPolygon(U, V, W, Z) → q6, u, v, w, z_1Polygon(N, A_1, B_1, C_1) → q7, n_1, a_2, b_2, c_2Polygon(F_1, G_1, S, T) → q9, f_1, g_1, s_1, t_1Point(xAxis) → I_1Polygon(Z, W, H_1, I_1) → q10, z_2, w_1, h_1, i_1Centroid(q1) → D_1Centroid(q2) → E_1Centroid(q3) → J_1IsInRegion(D_1, q4) → da_1IsInRegion(D_1, q5) → db_1IsInRegion(D_1, q6) → dc_1IsInRegion(E_1, q4) → ea_1IsInRegion(E_1, q5) → eb_1IsInRegion(J_1, q4) → ja_1IsInRegion(J_1, q5) → jb_1IsInRegion(J_1, q6) → jc_1IsInRegion(E_1, q6) → ec_1
AI Drawing Prompt Reference
Draw a graph showing the relationships and behaviors of sine, cosine, and tangent functions within the range of 0 to 90 degrees. Include a unit circle and right triangles to help understand the geometric significance and properties of trigonometric functions. Start by creating multiple polygons to represent the values of trigonometric functions at different angles, then mark key points on the unit circle and calculate the centroids of the polygons. Finally, determine if the centroids are within other polygons to illustrate the relationships between function values.
The prompt above was compiled from the original drawing commands and is for reference only.