
Sine & Cosine Graphs Comparison
Loading the math board and drawing, please wait…
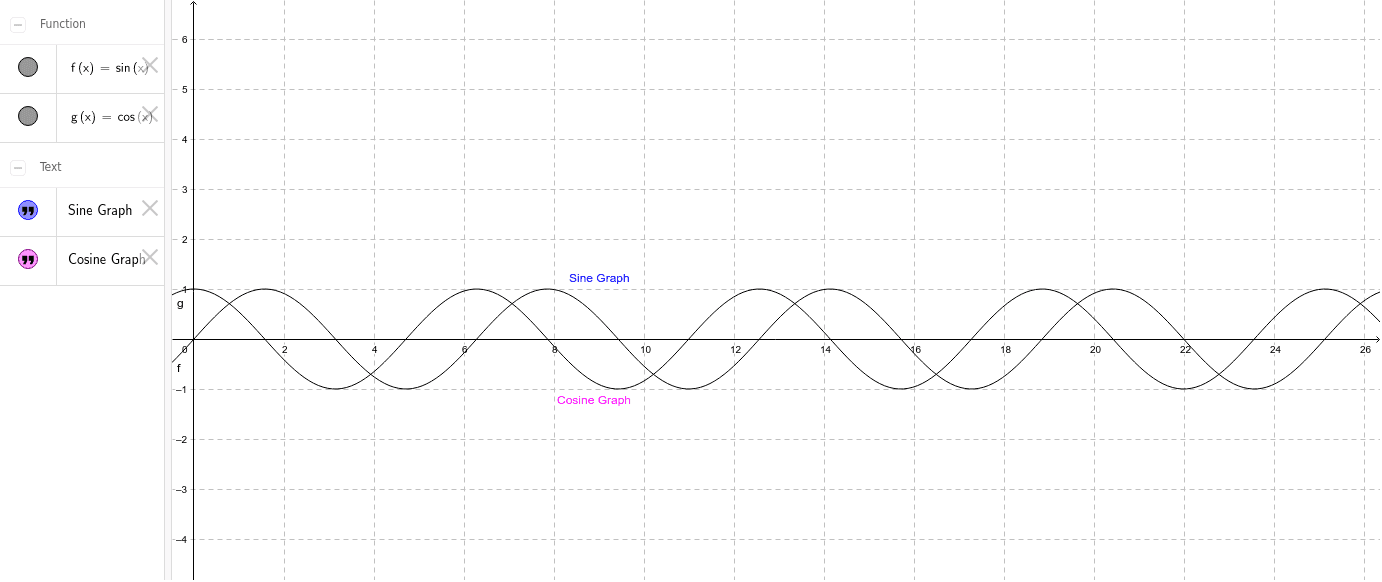
This GeoGebra example demonstrates the standard graphs of the sine and cosine functions side by side, highlighting their periodic nature, amplitude, and phase relationship. The core mathematical concepts include trigonometric periodicity, amplitude, phase shift, and the connection between the unit circle and the function graphs. Construction details: the example uses function objects f and g to plot y=sin(x) and y=cos(x) respectively, along with text objects text1 and text2 to label the curves or key points for easy comparison. It is suitable for high school students learning trigonometric graph properties, as well as for pre-calculus review, helping learners visualize the horizontal shift of π/2 between the sine and cosine curves.
GeoGebra Commands & Parameters
f(x) = sin(x)g(x) = cos(x)
AI Drawing Prompt Reference
Draw a coordinate system with two curves: one for sine and one for cosine. Both have amplitude 1 and period 2π. The sine curve starts at the origin, rises to a maximum, crosses the x-axis, drops to a minimum, and returns. The cosine curve starts at its maximum on the y-axis, then falls through the x-axis to a minimum and rises. The two curves are identical in shape but shifted horizontally by π/2, with cosine leading sine. Label each curve with its function name for easy comparison.
The prompt above was compiled from the original drawing commands and is for reference only.