
Sine and Cosine Graphs by Erik Jacobsen
Loading the math board and drawing, please wait…
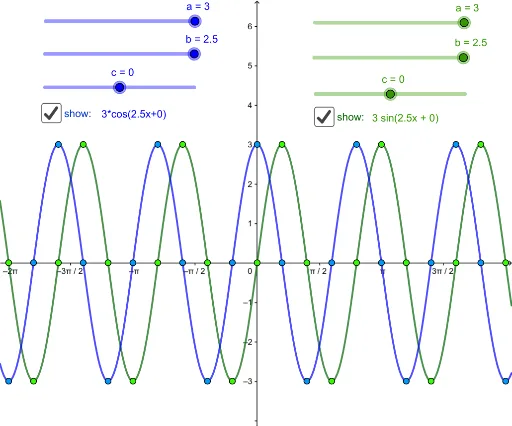
This example demonstrates the graphs of sine and cosine functions. It involves core concepts of trigonometry and uses GeoGebra commands such as Intersect and Extremum to dynamically show the properties of sine and cosine functions. Suitable for high school mathematics education, particularly in coordinate geometry and trigonometry.
GeoGebra Commands & Parameters
Intersect(f, h, -20, 20) → A, B, K, L, M, T, U, V, W, Z, A_1, Z_2, C, A_3, B_3, C_3, D_3, E_3, L_3, M_3, N_3, O_3, P_3, D, Q_3, E, F, G, H, I, JIntersect(g, h, -20, 20) → H_1, I_1, R_1, S_1, B_2, C_2, D_2, E_2, F_2, G_2, H_2, I_2, J_1, G_4, H_4, I_4, J_4, K_4, L_4, S_4, T_4, U_4, V_4, K_1, W_4, Z_4, L_1, M_1, N_1, O_1, P_1, Q_1Extremum(f, -20, 20) → P_2, Q_2, R, S, B_1, C_1, D_1, E_1, F_1, G_1, V_2, W_2, R_2, F_3, G_3, H_3, I_3, J_3, K_3, R_3, S_3, T_3, U_3, S_2, V_3, W_3, T_2, U_2, N, O, P, QExtremum(g, -20, 20) → Z_3, A_4, W_1, Z_1, A_2, J_2, K_2, L_2, M_2, N_2, O_2, M_4, B_4, N_4, O_4, P_4, Q_4, R_4, A_5, B_5, C_5, D_5, E_5, C_4, F_5, , D_4, E_4, F_4, T_1, U_1, V_1
AI Drawing Prompt Reference
Draw the graphs of sine and cosine functions on the same coordinate plane. Within the x-range from -20 to 20, mark all intersection points between each curve and a horizontal reference line using small dots. Also mark all local maxima and minima of each curve within this interval using a different symbol. The plot should clearly show the periodic oscillations, with intersection and extremum points evenly distributed along the curves, suitable for high school trigonometry instruction.
The prompt above was compiled from the original drawing commands and is for reference only.