
Line Generation via Vector Addition: Parametric Visualization
Loading the math board and drawing, please wait…
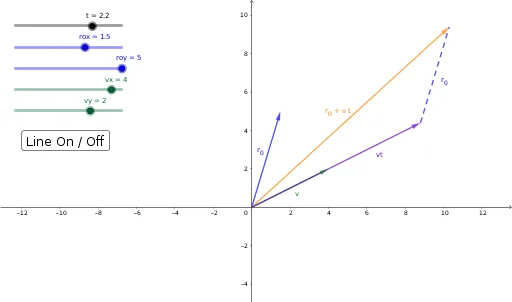
This GeoGebra example demonstrates dynamically generating a line using vector addition. Through the parametric representation r = r₀ + vt, it visualizes how a position vector r₀ combines with a direction vector v to form a line. Key mathematical concepts include the geometric meaning of vector addition, conversion between parametric and Cartesian forms, and the relationship between position and direction vectors. Construction highlights: Using Line, Vector, and Point commands to create an interactive model, with a slider for parameter t to animate the vector superposition process, clearly showing the parametric equation form r = r₀ + vt. Ideal for high school mathematics vector units, helping students understand parametric line equations and vector representations, suitable for introductory vector concepts and coordinate geometry foundations.
GeoGebra Commands & Parameters
Line(B, A) → fSegment(D, A) → hPoint(r) → EVector(E, D) → vt
AI Drawing Prompt Reference
Draw a coordinate-plane figure showing a line defined by two points (points B and A), representing line f. Also include the segment connecting point D to A (segment h) as part of the construction. Then create a point E in the same scene. Construct the vector vt as the direction from E toward D. The model should visually convey how adding a position vector r₀ to a direction vector scaled by a parameter t gives the parametric form r = r₀ + vt, emphasizing the geometric relationship between position and direction vectors that generate the line.
The prompt above was compiled from the original drawing commands and is for reference only.