
Sine and Cosine Functions: Unit Circle Dynamic Visualization
Loading the math board and drawing, please wait…
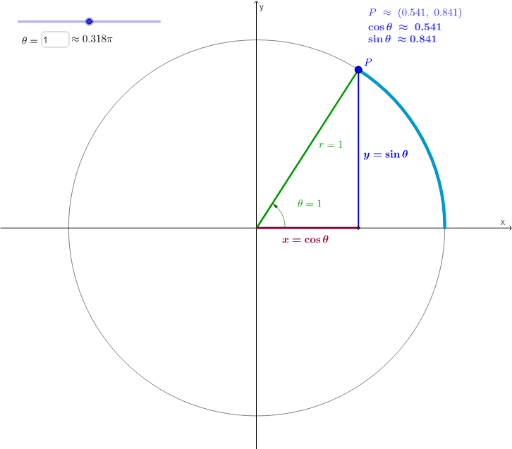
This GeoGebra example dynamically demonstrates the geometric definitions of sine and cosine functions using a rotating point on the unit circle, simultaneously showing how these functions generate their graphs. Core mathematical concepts include trigonometric functions (sine and cosine), the unit circle, angle-to-radian conversion, and right-triangle side ratios. Construction highlights: commands such as Point, Segment, Rotate, CircleArc, AngleArc, AngleArrow, and Textfield are used to build the circle, rotating radius, arcs, and angle markers; interactive InputBox1 and slider thetaVel allow users to control the angle or angular velocity; objects like CosPt, SinSegment, and CosSegment trace the cosine and sine projections, while the graph is plotted in the coordinate plane. This resource is ideal for high school or introductory college mathematics, helping students grasp periodicity, phase relationships, and the unit-circle definition of trigonometric functions, and can serve as an interactive exploration tool.
GeoGebra Commands & Parameters
Point(c) → TPSegment(O, xTP) → cosTPSegment(xTP, TP) → sinTPRotate(Zer, theta) → RadCircleArc(O, Zer, Rad) → arcCircleArc(O, Rad, Zer) → arc2Segment(O, Rad) → rTextfield(theta) → InputBox1Segment(O, CosPt) → CosSegmentSegment(CosPt, Rad) → SinSegmentAngleArc(theta) → aAngleArrow(theta) → b, d, u