
Sine and Cosine Explorer: Unit Circle, Slider, and Function Graphs
Loading the math board and drawing, please wait…
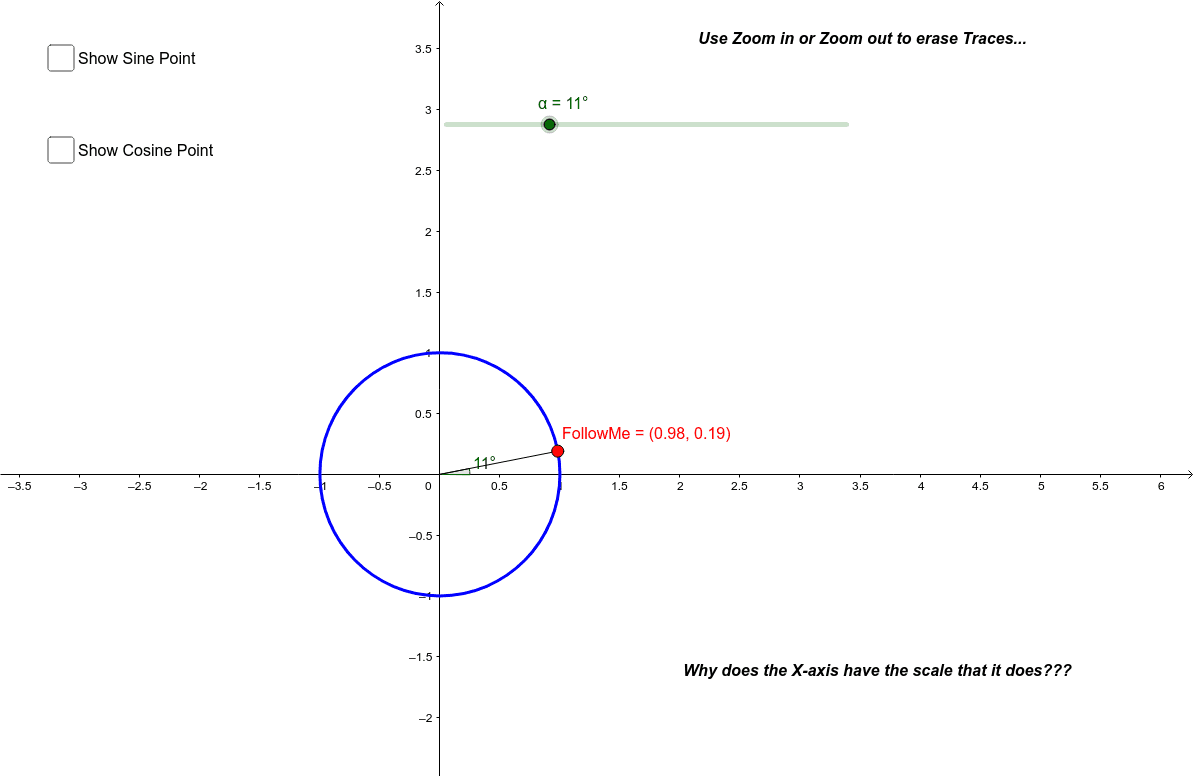
This example demonstrates how a point moving on the unit circle changes sine and cosine values and how those values appear on function graphs. It covers unit circle, radian angle, sine, cosine, coordinate projection, parameter variation, and graph linkage. Construction uses Point to create moving point A, Circle to define unit circle c, Intersect and Rotate to build angle and rotation relationships, Segment to draw radius and projection segments, Angle to label α, β, γ, and objects Sine, Cosine, text1, text2 to display values and notes. A slider controls the point, while checkboxes can toggle plots. Suitable for middle or high school trigonometry, unit-circle introduction, function graph exploration, and dynamic geometry lessons.
GeoGebra Commands & Parameters
Point(yAxis) → ACircle(A, 1) → cIntersect(c, xAxis, 2) → BRotate(B, α, A) → FollowMeSegment(A, FollowMe) → aAngle(B, A, FollowMe) → β
AI Drawing Prompt Reference
Draw a unit circle centered at a point on the y‑axis with radius 1; mark the rightmost intersection of the circle with the x‑axis; introduce a variable angle α and rotate that intersection about the center by α to obtain a movable point on the circle; draw the radius segment from the center to the movable point; and indicate the central angle formed by the fixed intersection, the center, and the movable point.
The prompt above was compiled from the original drawing commands and is for reference only.