
Simulation Experiment
Loading the math board and drawing, please wait…
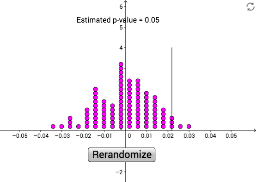
This example demonstrates the process of a simulation experiment, involving core mathematical concepts such as normal distribution and confidence intervals. Using GeoGebra commands like Sequence, Join, Shuffle, etc., it dynamically shows the generation and analysis of simulated data. Suitable for high school statistics courses.
GeoGebra Commands & Parameters
Sequence(1, a, 1, 41) → list1Sequence(0, a, 1, 959) → list2Join({list1, list2}) → list3Shuffle(list3) → list4Take(list4, 1, 500) → lowdoseTake(list4, 501, 1000) → placeboDotPlot(data, false, 0.2) → list5Segment((0.022, 0), (0.022, 4)) → f
AI Drawing Prompt Reference
Create a simulation experiment graph, showing the process of generating and analyzing simulated data. First, create two sequences, then join and shuffle them. Next, extract data for low dose and placebo, and finally use a dot plot to display these data. Add a vertical line as a reference in the graph.
The prompt above was compiled from the original drawing commands and is for reference only.