
Simple Planar Graph Example
Loading the math board and drawing, please wait…
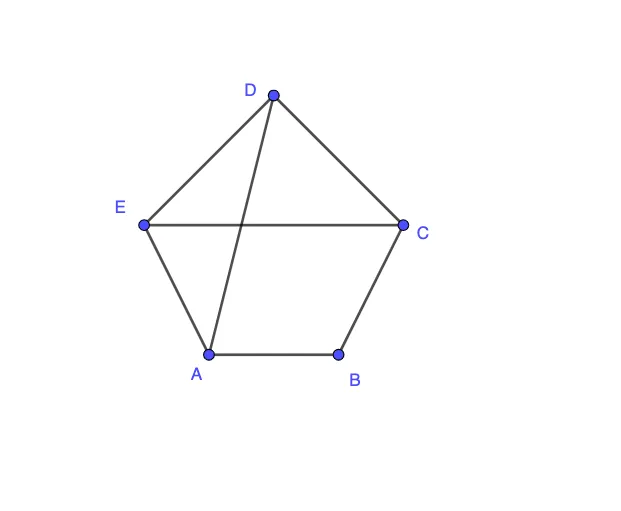
This is a simple planar graph example that demonstrates how to use GeoGebra to draw the intersection points of straight lines and circles. By examining the commands in the construction summary, one can understand how to use Segment (line segment), Intersect (intersection), and If (conditional statement) commands to create the graph. Suitable for middle school and above students to learn plane geometry and linear equations.
GeoGebra Commands & Parameters
Segment(A, B) → L1Segment(B, C) → L2Segment(C, D) → L3Segment(D, E) → L4Segment(E, A) → L5Segment(A, D) → L6Segment(E, C) → L7Intersect(L1, L3) → P13Intersect(L1, L4) → P14Intersect(L2, L4) → P24Intersect(L2, L5) → P25Intersect(L3, L5) → P35Intersect(L2, L6) → P26Intersect(L1, L7) → P17Intersect(L6, L7) → P67If(Defined[P13] ∨ Defined[P14] ∨ Defined[P24] ∨ Defined[P25] ∨ Defined[P35] ∨ Defined[P26] ∨ Defined[P17] ∨ Defined[P67], 0, 1) → output
AI Drawing Prompt Reference
Draw a simple planar graph on a plane. Start by choosing five vertices and connecting them with line segments to form a closed pentagon, then add two extra diagonals to keep the structure connected. Next, compute the intersection points for selected pairs of segments: include intersections between certain pentagon edges and diagonals, as well as intersections involving a diagonal with another segment. Display only the intersection points that are actually defined, producing a network of valid intersection nodes.
The prompt above was compiled from the original drawing commands and is for reference only.