
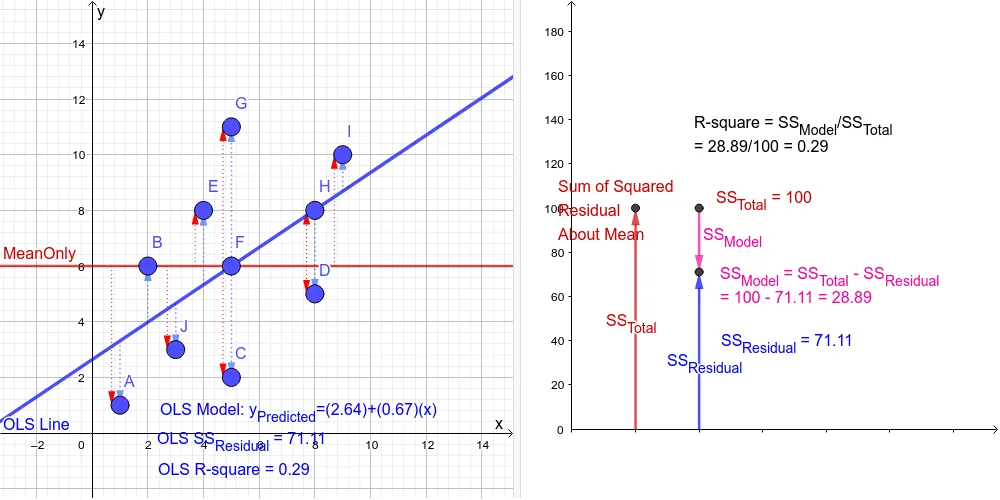
Simple Linear Regression - R-squared Visualization
Loading the math board and drawing, please wait…
① This GeoGebra example demonstrates the geometric meaning of R-squared (coefficient of determination) in simple linear regression, showing how data points relate to the fitted line. ② Core mathematical concepts include linear regression, least squares, Pearson correlation coefficient (PMCC), covariance, sample standard deviation, and the calculation and interpretation of R-squared. ③ Construction highlights: uses GeoGebra commands such as FitLineY to generate the best-fit line, SumSquaredErrors for residual sum of squares, and RSquare for the coefficient of determination; also constructs mean points, data points, residual vectors, and uses sliders or text to display dynamic values. ④ Suitable for high school and university statistics or data analysis courses, helping students understand the goodness of fit of regression models, and can be used for classroom demonstrations or self-directed exploration.
GeoGebra Commands & Parameters
Length(DataPoints) → SampleSizemean(DataX) → MeanXmean(DataY) → MeanYZip(Vector[(x(A), MeanY), A], A, DataPoints) → FromMeanXZip(Vector[(MeanX, y(A)), A], A, DataPoints) → FromMeanYPMCC(DataPoints) → CorrelationXYSampleSDX(DataPoints) → SXSampleSDY(DataPoints) → SYZip(Point[{A, B}], A, XZ, B, YZ) → DataPointsZZip(Vector[(x(A), 0), A], A, DataPointsZ) → FromMeanXZZip(Vector[(0, y(A)), A], A, DataPointsZ) → FromMeanYZPoint(yAxis) → UserPointALine(UserPointA, UserPointB) → YourLineSlope(YourLine) → UserSlopeSum((DataY - UserPredictedY)^(2)) → UserSSResidualVector(UserParameters, (UserIntercept, UserSlope, UserSSResidual)) → uFitLineY(DataPoints) → fSlope(f) → OLSSlopeSumSquaredErrors(DataPoints, f) → OLSSSResidualVector(OLSParameters, (OLSIntercept, OLSSlope, OLSSSResidual)) → vRSquare(DataPoints, f) → OLSRsqRSquare(DataPoints, YourLine) → UserRsqSumSquaredErrors(DataPoints, MeanOnly) → TotalSSResidualZip(Vector[(x(A), YourLine(A)), A], A, DataPoints) → UserResidualVectorZip(Vector[(x(A), f(A)), A], A, DataPoints) → OLSResidualVectorVector((1, 0), (1, TotalSSResidual)) → VectorTotalSSRVector((2, 0), (2, OLSSSResidual)) → VectorOLSSSRVector((2, TotalSSResidual), (2, OLSSSResidual)) → VectorModelSSRZip(Vector[(x(A) + MDisplace, MeanY), (x(A) + MDisplace, y(A))], A, DataPoints) → MeanResidualVector