
How Mean, Median, and SD Are Affected by Data
Loading the math board and drawing, please wait…
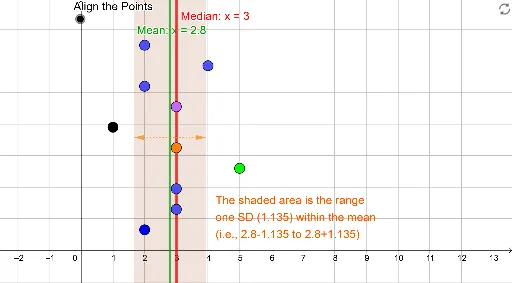
① This interactive GeoGebra example dynamically shows how the mean, median, and standard deviation (SD) change as data points are moved or added. ② It covers core statistical concepts: measures of central tendency (mean, median) and dispersion (variance, standard deviation), along with the sensitivity of these measures to data changes. ③ The construction uses GeoGebra commands such as Point to create data points, mean, Median, SampleVariance, SampleSDX for statistical calculations, and Vector, OrthogonalLine to draw reference lines (mean line, median line, SD range). It also employs Sum and Zip to compute the sum of squared errors, illustrating how a candidate value affects the total error. ④ Suitable for high school or introductory college statistics courses, this example serves as a visual demonstration of how outliers and data distribution influence statistical summaries, helping students grasp the robustness of median versus mean and the meaning of standard deviation.
GeoGebra Commands & Parameters
Point(xAxis) → CandidateOrthogonalLine(Candidate, xAxis) → fPoint(line1) → APoint(line2) → BPoint(line4) → DPoint(line3) → CPoint(line5) → EPoint(line6) → FPoint(line7) → GPoint(line8) → HPoint(line9) → IPoint(line10) → Jmean(Data) → DataMeanMedian(Data) → DataMedianSum((Data - CandidateX)^(2)) → SumOfSquaredErrorPoint({CandidateX, SumOfSquaredError}) → ErrorVsCandidateZip(Vector[Point[{CandidateX, y(A)}], A], A, DataPoints) → ErrorSum((Data - x)^(2)) → gSampleVariance(Data) → DataVarianceSampleSDX(DataPoints) → DataSDVector(Mark, SDLow) → uVector(Mark, SDHigh) → v