
Simple HSL Scheme Demonstration
Loading the math board and drawing, please wait…
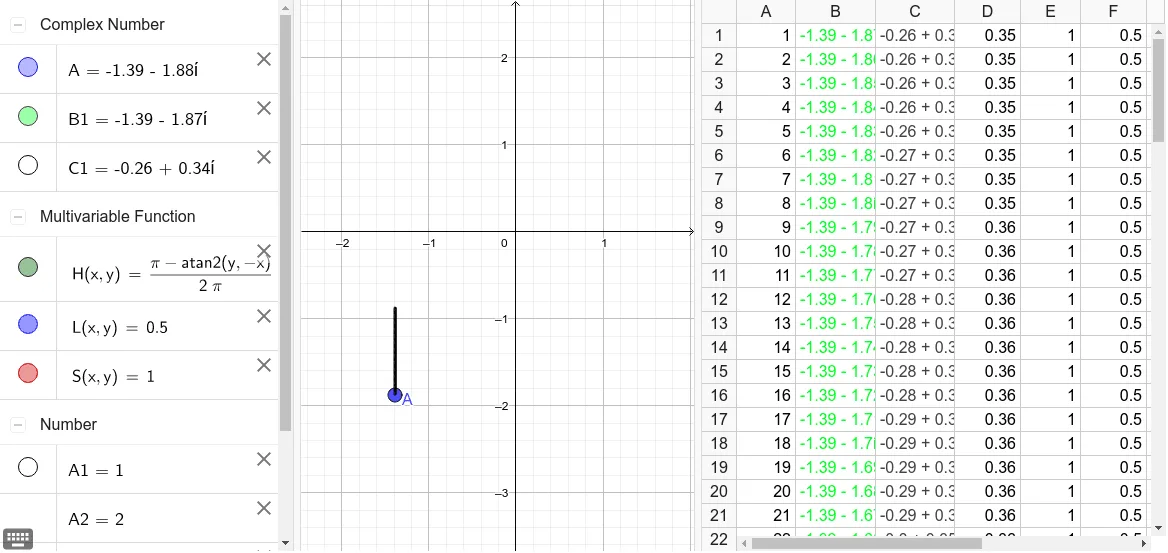
This example demonstrates how to use the HSL color scheme for domain coloring of complex functions, visually representing the characteristics of complex function graphs. Core math concepts include complex numbers, functions, and analytical geometry. Construction highlights involve parameters and dynamic visualization using objects A1-A40 as per the GeoGebra commands. Suitable for high school and above learners to understand complex function visualization techniques.
GeoGebra Commands & Parameters
1A1 + 1A2 + 1A3 + 1A4 + 1A5 + 1A6 + 1A7 + 1A8 + 1A9 + 1A10 + 1A11 + 1A12 + 1A13 + 1A14 + 1A15 + 1A16 + 1A17 + 1A18 + 1A19 + 1A20 + 1A21 + 1A22 + 1A23 + 1A24 + 1A25 + 1A26 + 1A27 + 1A28 + 1A29 + 1A30 + 1A31 + 1A32 + 1A33 + 1A34 + 1A35 + 1A36 + 1A37 + 1A38 + 1A39 + 1A40 + 1A41 + 1A42 + 1A43 + 1A44 + 1A45 + 1A46 + 1A47 + 1A48 + 1A49 + 1A50 + 1A51 + 1A52 + 1A53 + 1A54 + 1A55 + 1A56 + 1A57 + 1A58 + 1A59 + 1
AI Drawing Prompt Reference
Create a domain coloring illustration for a complex function using the HSL color scheme, showing how function values vary across the complex plane. Include a sequence of points arranged in order, each incrementing by 1 from the previous one, forming a continuous chain of values. These points are placed on the complex plane, with colors representing phase and magnitude information. The composition emphasizes the relationship between color and numerical values, suitable for educational demonstration of complex function visualization.
The prompt above was compiled from the original drawing commands and is for reference only.