
Shifting Sine: Visualizing Translations of the Sine Function
Loading the math board and drawing, please wait…
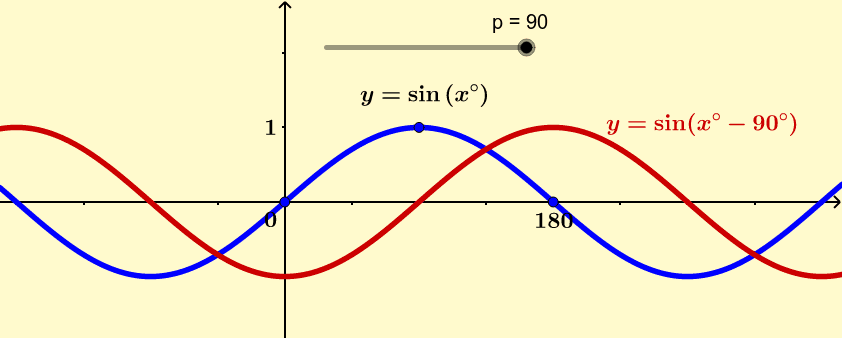
① This example dynamically demonstrates how the graph of the sine function shifts horizontally and vertically when parameters are adjusted, making the geometric meaning of function transformations clear. ② Core mathematical concepts include the sine function, translation of function graphs, and how parameter changes affect the function's expression and graph position, bridging trigonometry and transformation geometry. ③ Construction highlights: Using GeoGebra, multiple objects (f, A1–A10, p, A, B, C, D, g) are created, likely with sliders or draggable points to control shift amounts, and text objects (text1–text8) label key values. The construction may involve defining the sine function, tracking point coordinates, and plotting the transformed graph. ④ Suitable for high school students learning trigonometric graph transformations, and for teachers demonstrating how horizontal and vertical shifts alter the sine curve's phase and position.
GeoGebra Commands & Parameters
f(x) = sin(x°)1A1 + 1A2 + 1A3 + 1A4 + 1A5 + 1A6 + 1A7 + 1A8 + 1A9 + 1Numeric p(90.0)(90, 1)(180, 0)(0, 0)g(x) = sin(x° - p°)(p + 90, 1)