
Shifting and Scaling Data
Loading the math board and drawing, please wait…
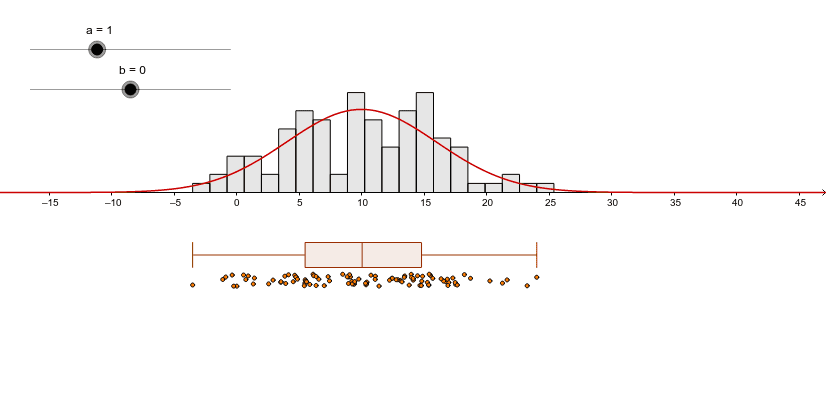
This example demonstrates the effect of adding or multiplying a constant value to each data point. By adjusting parameters, observe the data's shifting and scaling. Key mathematical concepts include data transformation, translation, and scaling. Utilizes Sequence, Min, BoxPlot, Zip, and Histogram commands in GeoGebra. Suitable for statistics education and data analysis.
GeoGebra Commands & Parameters
Sequence(RandomNormal[10, 6], k, 1, 100) → list1Sequence(Min[list3] + ((Max[list3] - Min[list3]) * k / n), k, 0, n + 1) → list2Min(list1) → cBoxPlot(-5, 1, list3, true) → eZip((el, (-7) + RandomUniform[-0.5, 0.5]), el, list3) → list4Histogram(list2, list3, true) → d
AI Drawing Prompt Reference
First, create a set of random normal distribution data points. Then, apply shifting and scaling operations to these points by adjusting parameters to observe changes. Next, draw a box plot and histogram to show the distribution of the data. Finally, compare the original data points with the shifted and scaled points to understand the impact of data transformation.
The prompt above was compiled from the original drawing commands and is for reference only.