
Shading Venn Diagrams by Kate MacInnis
Loading the math board and drawing, please wait…
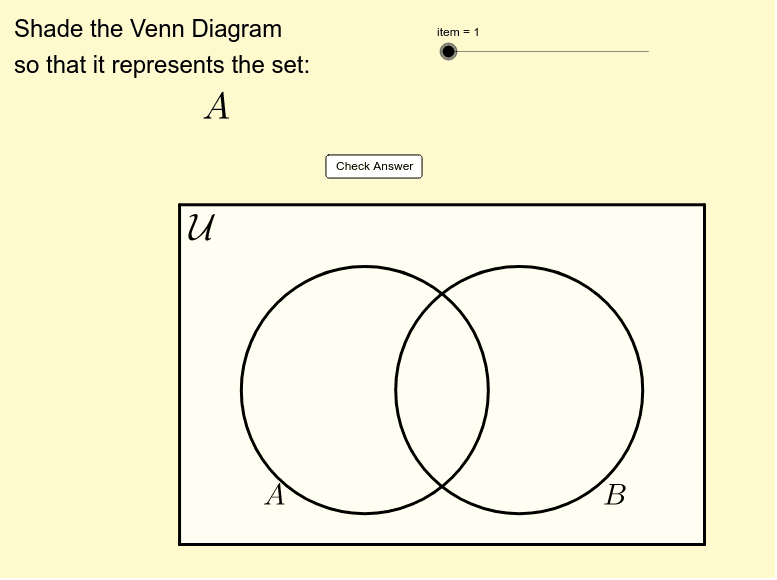
This example asks students to shade a Venn diagram with two sets to represent various set operations. GeoGebra checks the answer and provides feedback. It covers core concepts of set theory and is suitable for middle school and above students. Commands used include Segment, If, Element, Length, Polygon, and Corner.
GeoGebra Commands & Parameters
Segment((x_1, y_1), (x_1, y_2)) → eSegment((x_1, y_2), (x_2, y_2)) → fSegment((x_2, y_1), (x_2, y_2)) → gSegment((x_2, y_1), (x_1, y_1)) → hIf(IsGreen1, 0, 1) → RB1If(IsGreen1, 0.4, 1) → G1If(IsGreen2, 0, 1) → RB2If(IsGreen3, 0, 1) → RB3If(IsGreen4, 0, 1) → RB4If(IsGreen2, 0.4, 1) → G2If(IsGreen3, 0.4, 1) → G3If(IsGreen4, 0.4, 1) → G4Element(problem, item, 1) → textitemLength(problem) → iElement(problem, item, 2) → keyPolygon(Corner[1], Corner[2], Corner[3], Corner[4]) → poly1, l, m, n, qCorner(5) → G
AI Drawing Prompt Reference
Draw a Venn diagram with two overlapping circles, shading different regions with colors to represent set operations. First, draw two intersecting circles, then fill the overlapping and non-overlapping areas with different colors based on conditions, and finally add text labels describing the set operations.
The prompt above was compiled from the original drawing commands and is for reference only.