
Interactive Euler Diagrams for Subset Relationships
Loading the math board and drawing, please wait…
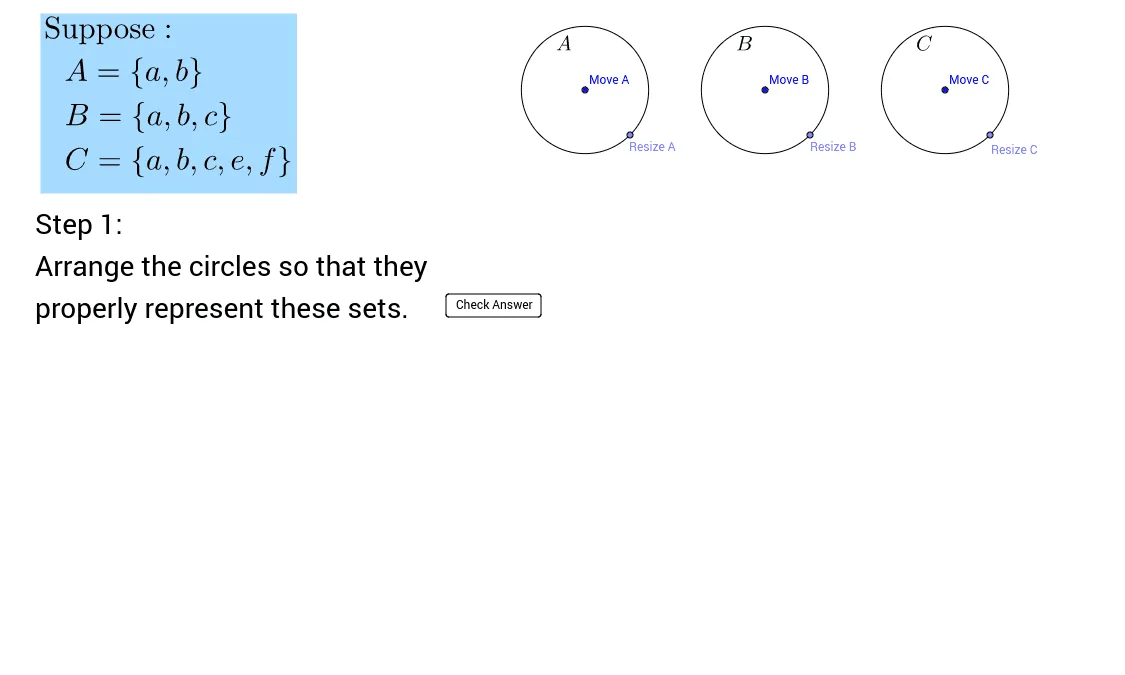
This GeoGebra example demonstrates a two-step interactive Euler diagram activity where students arrange circles to represent subset relationships among sets. It covers set theory, subsets, Euler diagrams, spatial containment, and logical verification. The construction uses Point, Circle, Polygon, and Corner commands, with objects such as A, B, and C circles, stage buttons, text prompts, correctness flags, and feedback messages to guide students through Stage 1 and Stage 2. It is suitable for middle school, high school, or introductory discrete mathematics lessons, providing self-checking practice and classroom demonstration.
GeoGebra Commands & Parameters
Point(Line[B_1, y = -x]) → B_2Circle(B_1, B_2) → BPoint(Line[A_1, y = -x]) → A_2Circle(A_1, A_2) → APoint(Line[C_1, y = -x]) → C_2Circle(C_1, C_2) → CPolygon((x1, y1), (x1, y2), (x2, y2), (x2, y1)) → poly1, p1, p4, p3, p2Polygon(Corner[1], Corner[2], Corner[3], Corner[4]) → blankout, g, h, i, jCorner(5) → D
AI Drawing Prompt Reference
Draw three interconnected circles representing sets. The first circle is larger, the second is smaller and inside the first, and the third is inside the second. Ensure clear boundaries and overlapping areas, and label each circle.
The prompt above was compiled from the original drawing commands and is for reference only.