
Sequence Limit Demonstration
Loading the math board and drawing, please wait…
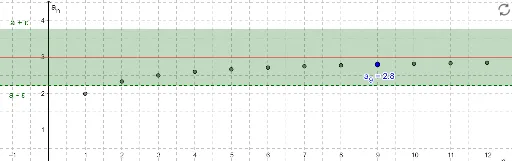
This example visually demonstrates the concept of sequence limits by showing how sequence terms approach a limit value through dynamic geometry. Key math concepts include sequences, limits, and ε-δ definitions. It is constructed using commands like Intersect, Sequence, Textfield, and LaTeX, with objects such as a, gw, n, P, ε, g_1, g_2. Suitable for high school and above students for understanding limits and visualizing mathematical concepts.
GeoGebra Commands & Parameters
Intersect(g, yAxis) → AIntersect(g_1, yAxis) → BIntersect(g_2, yAxis) → CSequence((k, a(k)), k, 1, 30) → Liste1Textfield(a) → Textfeld1LaTeX(a, true, true) → Text1
AI Drawing Prompt Reference
Create a dynamic geometry visualization showing how sequence terms approach a limit value, featuring a horizontal line, two curves, and multiple points moving from left to right along the horizontal line, gradually converging to the limit value, with labels for sequence terms and the limit, text displaying the current sequence term, and a mathematical formula for the ε-δ definition of the limit.
The prompt above was compiled from the original drawing commands and is for reference only.