
Sequence Graph Plotter
Loading the math board and drawing, please wait…
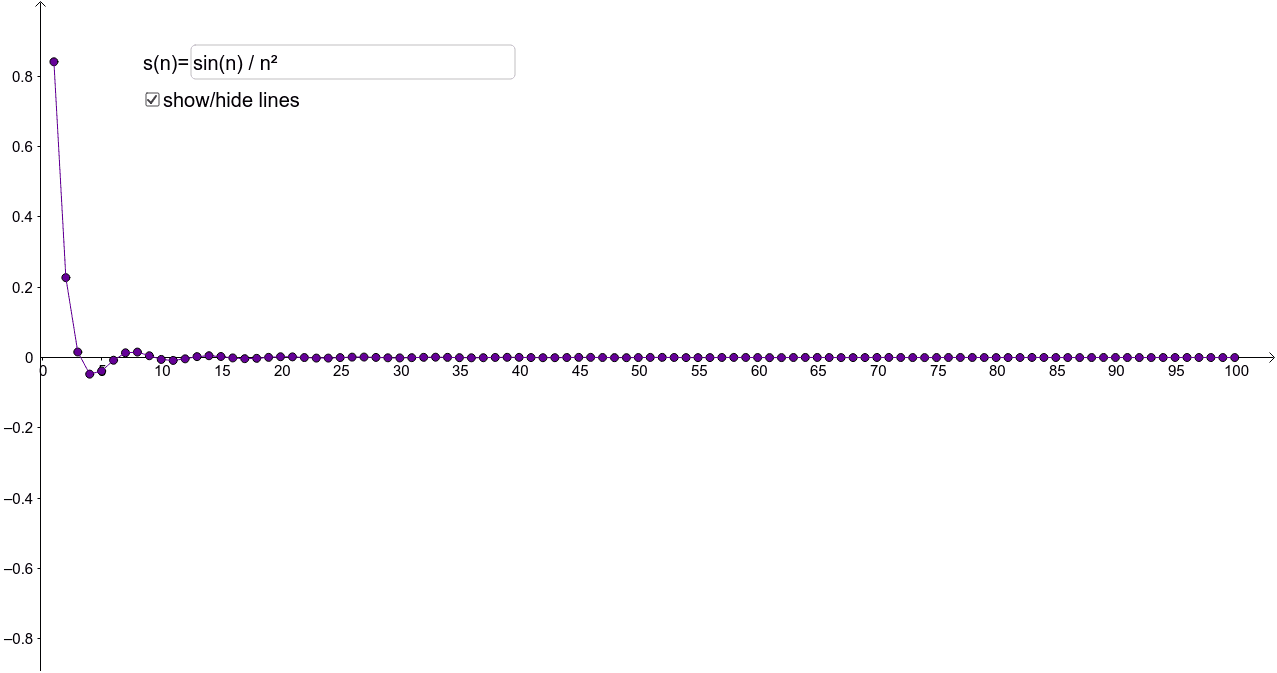
This is a very basic sequence graph plotter. It demonstrates the graphical representation of sequences, involving core mathematical concepts such as sequences and function graphs. Using the Sequence command, the graph of the sequence can be generated. Suitable for high school mathematics education and learning.
GeoGebra Commands & Parameters
Sequence((n, s(n)), n, 1, N) → list1Sequence(Segment[(n, s(n)), (n + 1, s(n + 1))], n, 1, N - 1) → list2Textfield(s) → inputBox1
AI Drawing Prompt Reference
Plot a graph of a sequence defined by the function s(n), starting from n=1 up to N. First, plot the points of the sequence, then connect these points with line segments to form the sequence graph. An input box is used to enter the definition of the sequence s(n).
The prompt above was compiled from the original drawing commands and is for reference only.