
Seminar: Regression and Correlation
Loading the math board and drawing, please wait…
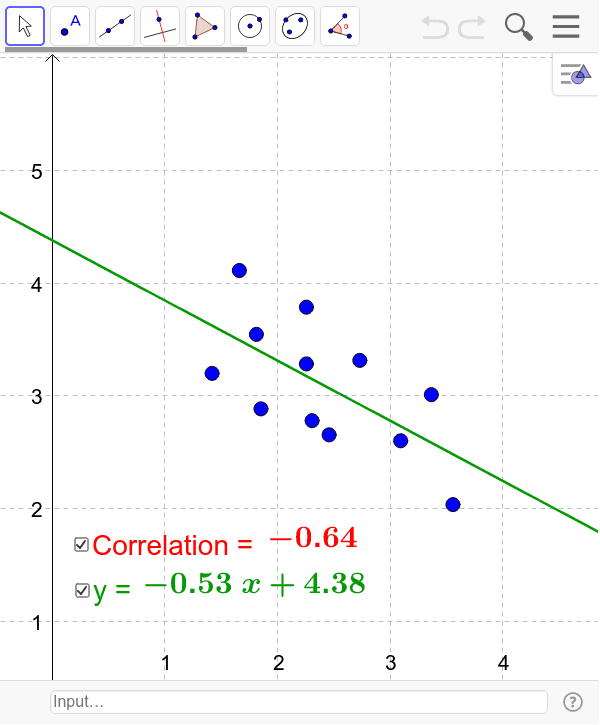
Move points to demonstrate correlation and least squares regression line. This example covers correlation and linear regression concepts. GeoGebra commands used include PMCC and FitPoly. Suitable for statistics and data analysis courses.
GeoGebra Commands & Parameters
PMCC(X) → corFitPoly(X, 1) → f
AI Drawing Prompt Reference
Please draw a figure that demonstrates correlation and the least squares regression line. First, create a set of points and move them to show different correlations. Then, calculate the Pearson correlation coefficient for these points. Next, draw a least squares regression line through these points. This figure is suitable for statistics and data analysis courses covering correlation and linear regression concepts.
The prompt above was compiled from the original drawing commands and is for reference only.