
Self-Similarity: Bouncing Ball Trace Example
Loading the math board and drawing, please wait…
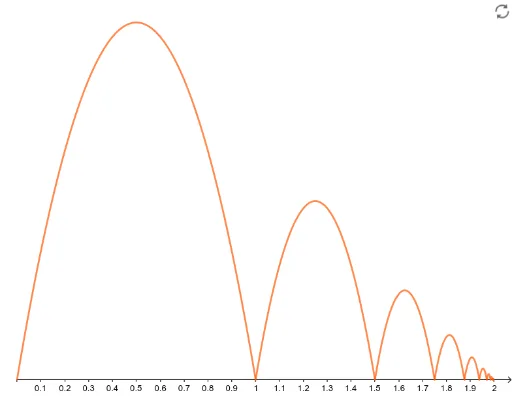
This example demonstrates the self-similarity in the trace of a bouncing ball, involving concepts like fractal geometry, parabolas, quadratic functions, distributions, volume, geometric distribution, and pyramids. It is constructed using GeoGebra commands and objects such as A1-A20 and B2-B19, making it suitable for high school mathematics education or exploring the connection between fractals and function graphs.
GeoGebra Commands & Parameters
20A1 / 2A2 / 2A3 / 2A4 / 2A5 / 2A6 / 2A7 / 2A8 / 2A9 / 2A10 / 2A11 / 2A12 / 2A13 / 2A14 / 2A15 / 2A16 / 2A17 / 2A18 / 2A19 / 2A2 + B1A3 + B2A4 + B3A5 + B4A6 + B5A7 + B6A8 + B7A9 + B8A10 + B9A11 + B10A12 + B11A13 + B12A14 + B13A15 + B14A16 + B15A17 + B16A18 + B17A19 + B18A20 + B19(B1, 0)(B2, 0)(B3, 0)(B4, 0)(B5, 0)(B6, 0)(B7, 0)(B8, 0)(B9, 0)(B10, 0)(B11, 0)(B12, 0)(B13, 0)(B14, 0)(B15, 0)(B16, 0)(B17, 0)(B18, 0)(B19, 0)(B20, 0)
AI Drawing Prompt Reference
Draw a graph demonstrating self-similarity in a bouncing ball's trace, involving multiple parabolas to illustrate fractal geometry and quadratic functions. Start by plotting several horizontal line segments, then generate multiple parabolic trajectories based on these segments to show the repetitive and similar paths of a bouncing ball, emphasizing the geometric distribution and volume relationships, suitable for high school mathematics education exploring the connection between fractals and function graphs.
The prompt above was compiled from the original drawing commands and is for reference only.