
Second Derivative Plot by Mike May
Loading the math board and drawing, please wait…
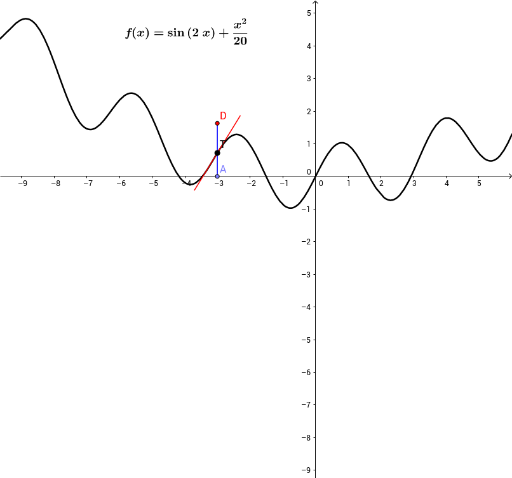
This example demonstrates how to plot a function along with its first and second derivatives. It involves core math concepts like functions, derivatives, first derivative, and second derivative. Construction highlights include using commands like Segment, Point, If, Line, Slope, Textfield in GeoGebra. Suitable for high school and above learners to understand the geometric and physical significance of functions and their derivatives.
GeoGebra Commands & Parameters
Segment((xmn, 0), (xmx, 0)) → aPoint(a) → ASegment(T - (0.7 * (1, m)), T + (0.7 * (1, m))) → TanSegIf(togA ≟ 1, "Stop animation", "Animate A") → AnimateSegment(A, D) → ADLine(T, T + (1, m)) → TanLineSlope(TanSeg) → m_1Textfield(f) → InputfOFxTextfield(speed) → InputSpdIf(togT ≟ 0, "Show Traces", "Stop Traces") → ShowTracesSegment(D - (0.7 * (1, m2)), D + (0.7 * (1, m2))) → Tan2Seg