
Scatter Plot and Related Math Concepts Demo
Loading the math board and drawing, please wait…
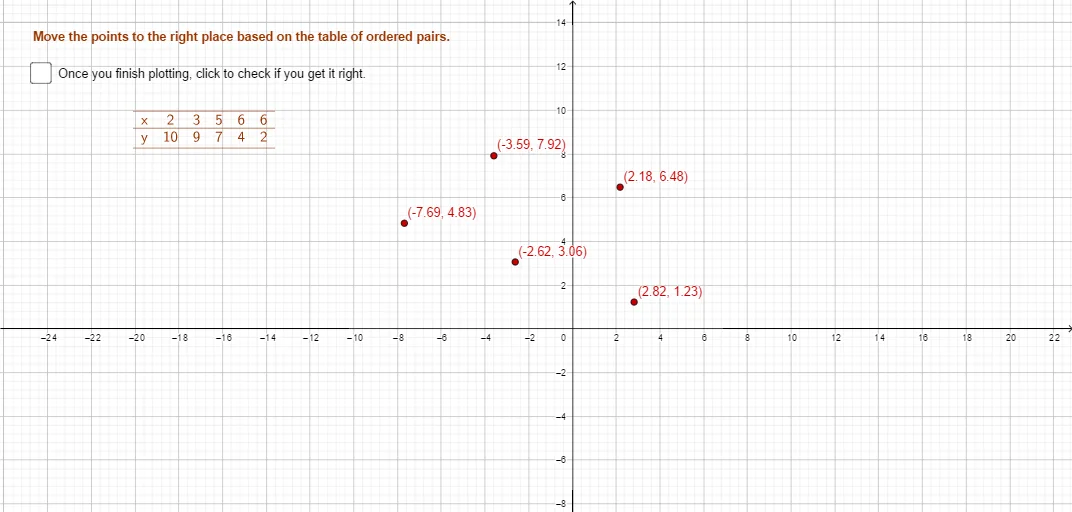
This example demonstrates data distribution through scatter plots, linking core mathematical concepts such as median value, line segments, unit circle, hypergeometric distribution, and logarithms. Key math concepts include scatter plot visualization, median calculation, geometric relationships between line segments and unit circles, hypergeometric distribution probability models, and logarithmic function properties. Construction highlights from the GeoGebra command summary involve the use of TableText to create table-based text elements, interacting with objects like A, B, C, D, E, a, F, G, H, I, J, text1, text2 for mathematical representation. Suitable for high school and above learners to explore the integration of data analysis, geometric construction, and probability statistics.
GeoGebra Commands & Parameters
TableText({"x", 2, 3, 5, 6, 6}, {"y", 10, 9, 7, 4, 2}, "c__") → text2
AI Drawing Prompt Reference
Draw a scatter plot to show data distribution. Include a table with x and y values, and points A, B, C, D, E. Also draw a line segment connecting A and B, and a unit circle. Ensure the graph is clear for understanding data relationships.
The prompt above was compiled from the original drawing commands and is for reference only.